Posts

Showing posts from November, 2019

Rallies Continue Their Gains
Image
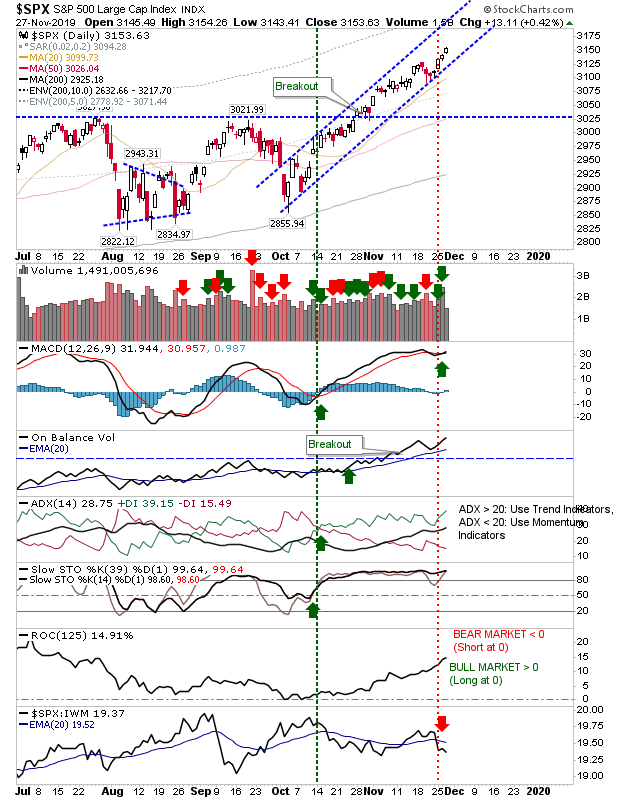
Bulls are starting to put a bit of distance on the prior consolidation of early November and this will only make it easier to extend gains when Santa comes to town.  As it stands, all bar the Russell 2000 are at multi-year (10-year+) highs. The S&P is running inside a rising channel with well defined support and resistance. It's still underperforming against the Russell 2000, but other technicals have returned net positive.

Indices Inch Higher

Image
Indices didn't make big percentage moves, but gains were welcome and followed from morning gaps on higher volume accumulation. The S&P managed to make a new closing high although it did lose relative ground against the Russell 2000 - enough to register as a 'sell' trigger. However, this is bullish for the broader market as money rotates into more speculative issues.

Indices look to support at 20-day MAs

Image
There wasn't a whole lot to Friday's action but for many indices the week finished with a  sequence of 2-3 dojis at - or just above - 20-day MAs. There was some creeping weakness with MACD trigger sell signals, but other technicals were still positive enough to make this a minor concern. For the S&P, the last couple of days action on the week came with falling volume; for a rally which has moved consistently higher since October, some sideways action can be expected.

Sellers emerge with volume, but no real damage done

Image
No surprise to see profit takers make an appearance on heavy volume distribution. Despite the selling there was no real damage done to indices. The Russell 2000 was closest to breakout support but today's selling just managed to tag breakout support without violating the support level. There is a MACD trigger 'sell' to reverse along with a relative under-performance against the the S&P.

Small gains leaves things unchanged

Image
Very little to say about today. Small gains keeps things positive although volume was light. We are coming to a point when rallies in the S&P and Nasdaq needs to develop a consolidation which at the very least moves things sideways - if not, down. The rally in the S&P hasn't stopped since October and a test of the 20-day MA would be welcome at this stage. However, On-Balance-Volume does have a breakout in support of price action - so the rally is not concurring in isolation.

Rallies kick on; Large Caps have best of action

Image
After a relatively narrow trading range, Friday saw indices kick on with higher volume accumulation. With higher volume accumulation the S&P delivered a new swing high with a bullish cross in relative performance against the Russell 2000. On-Balance-Volume finished with a new multi-year high.

Russell 2000 Makes Support Test

Image
Rallies continued for indices with the exception of the Russell 2000, which made a support test of the breakout level. The Russell 2000 support test is helped by the proximity of the 20-day MA, although it's on the verge of a MACD trigger 'sell'.

Tick Tock Rally Continues

Image
Very little to add from what has gone before; rallies continue higher with supporting technicals still positive (no bearish divergences of concern). The S&P continues a run of small gains which keeps bulls happy without risking a run-away extension which could encourage early profit taking. The index is under-performing against the Russell 2000 - which is healthy in a cyclical rally.

Rallies Extend

Image
Friday was more of the case of preserving gains and undoing some of the potential 'topping' candlesticks which had emerged on Thursday.  Volume was down from the previous day, but there is now a decent buffer across markets to protect against future weakness. The S&P has matching breakouts for price and On-Balance-Volume but the index continues to underperform relatively against Small Caps.

Index Breakouts Hold

Image
No real surprises today but the most important aspect to today's trading was the fact index breakouts held for another day. Small Caps lost a little ground but didn't undercut the breakout level.

Dow Breaksout

Image
Monday it was the turn of the Dow Jones Industrial Average to break higher, joining the S&P. Despite this, the index is still underperforming against the Nasdaq 100.

Nasdaq and Small Caps Breakout

Image
After the success in the S&P and Semiconductor Index it was now the turn of the Nasdaq to follow the lead action. The Nasdaq pushed above 8,330 resistance on lighter volume but net bullish technicals.

Archive

Show more