Posts

Showing posts from March, 2015

Inside Day Keeps Things Open

Image
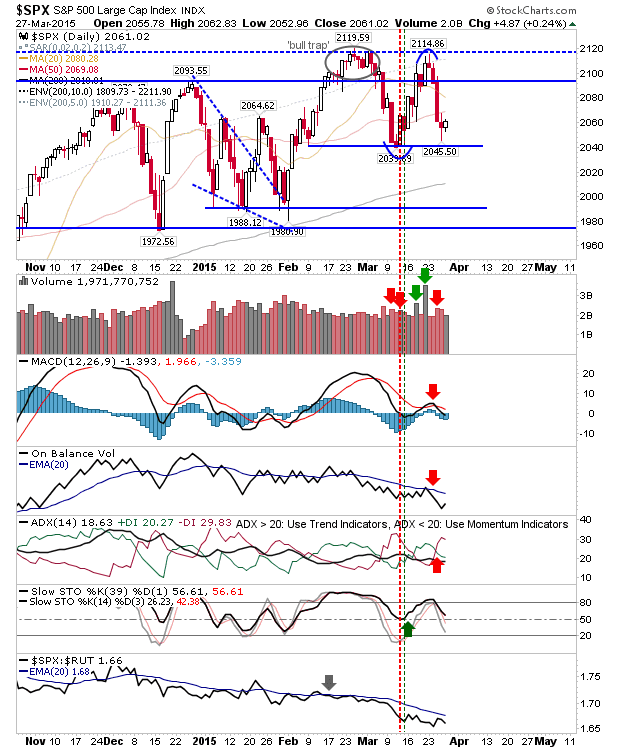
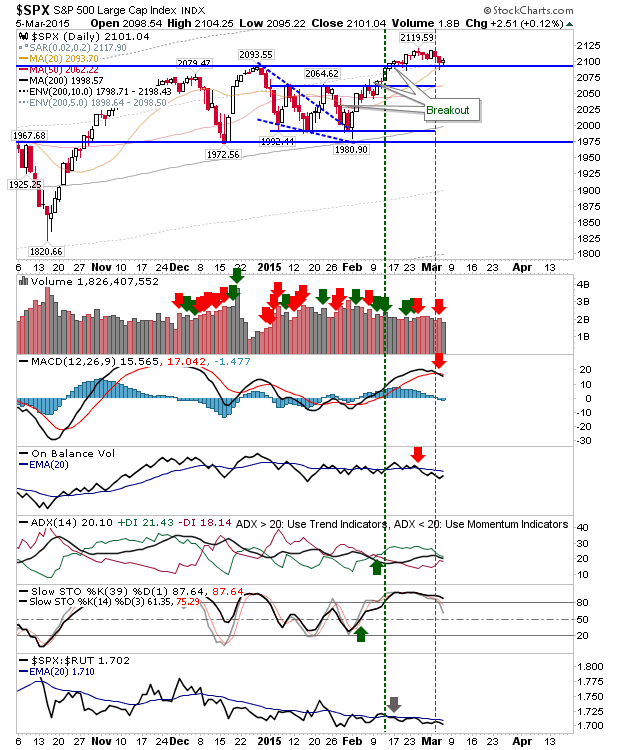
Large and Small Caps traded inside yesterday's range, closing lower against yesterday's higher close. While yesterday's buying hasn't been totally eliminated, it will have put a dent in bullish confidence. Watch for follow through selling tomorrow. While the S&P closed above the 20-day and 50-day MA yesterday, today it closed below each of these MAs.  Technicals only require a stochastic drop below the bullish mid line to turn net bearish. Relative performance against the Russell 2000 also accelerated downwards.

Small Caps pressuring 'Bull Trap'

Image
The Dow had the best of the action, with higher volume buying to close the day out. The index closed above the 20-day and 50-day MAs. The next challenge is to push above 18,100; which is the 'bull trap' and the recent spike push to 18,205.

Potential for Trading Range

Image
Indices trading near support, but Friday's close didn't do enough to pull away from support. Monday offers a chance for bulls to make back lost ground, although given this is the second run at support for March there is a higher chance of support failure. In addition, Friday's buying volume was lighter. The S&P continued its under-performance relative to the Russell 2000 and Nasdaq. The 20-day moving average is an opportunity for shorts to attack should bulls be able to mount some follow through from Friday. Otherwise, a cut below Friday's open at 2063 could open the flood gates for bears. Bulls will really need a move above 2095 for confidence to return. The Nasdaq was able to defend its 50-day MA and with Intel looking to takeover Altera there may be room for further gains. As with the S&P, Friday's trading volume was light. If bulls do make an appearance on Monday then watch if bears turn up the heat at the 20-day MA. The Russell 2000 is proba

Nasdaq finishes on 50-day MA

Image
There was some carryover from yesterday's heavy day of selling. My tracking of ETF alerts for Zignals didn't mark a trend reversal for ultrashort ETFs, only ultralongs; suggesting yesterday's selling was primarily driven by profit taking and not shorting activity. Today's action brought indices closer to support, which slowed the rate of loss. The S&P closed with a neutral 'spinning top' on lighter volume. The 50-day MA didn't offer much support, but the low at 2,039 remains valid.

Big Sell Offs - But Confirmation Required

Image
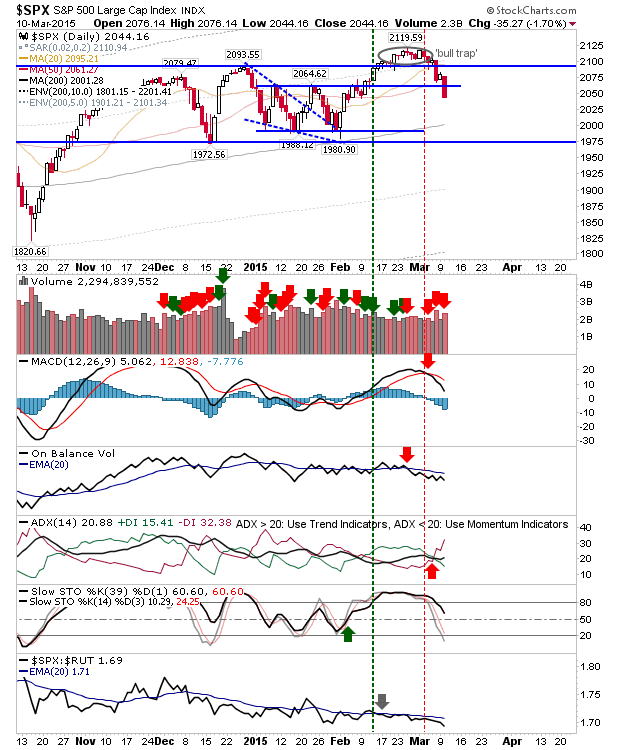
A difficult day for bulls as sellers swarmed out of the gates. Volume climbed to register distribution across all indices as technical weakness expanded. The S&P finished the day below its 50-day MA, but hasn't yet challenged support of the March swing low at 2,039. If a double top is to emerge, then a close below 2,039 is required; if this plays true, look for a downward target of 1,965. Technicals already point in shorts favour with a MACD 'sell' trigger and bearish cross of +DI / -DI.

Low Volume Weakness

Image
Sellers were able to put some distance on resistance which gives shorts something to work with. The S&P closed just below 2093 support, but above 20-day MA; a loss of the latter opens up support at the 50-day MA, then the swing low at 2040.

Large Cap 'Bull Traps' Not Quite Done

Image
There was a small loss in the indices as Friday's gains consolidated. The S&P closed with a tweezer top, which is a reasonable marker for a bearish (and potentially trade-worthy) reversal. There are zones of support which will stall any decline, but for tomorrow, look for follow through losses.

Large Cap 'Bull Traps' Under Pressure

Image
Friday's solid gains helped push both the Dow Jones Industrial Average and S&P into challenges of their respective 'Bull Traps'. The big volume surge also marked a strong accumulation day for both indices. In the case of the S&P, there was a MACD trigger 'buy', but not quite an On-Balance-Volume 'buy' trigger, with which to work with.

Bullish Pressure Continues

Image
The Nasdaq posted a minor gain on low volume and performed better than the S&P. It didn't really change anything, but it didn't hurt and the MACD is on the verge of a 'strong buy' signal.

Small Caps Breakout

Image
Janet Yellen signaled the not to surprising start to interest rate hikes, and markets along with EURUSD, rallied on the news. Best action was to be found in the Russell 2000. It managed to break key resistance and bank some distance from the year long consolidation. Today's action was excellent news for bulls looking for a new phase in the 2009-present day bull market; it's starting to look like 2015 will be the year for Small Caps.

Happy St. Patrick's Day

Image
The day is probably over for most of you, but for those on the West Coast, or my old Hawaii stomping ground, Happy Paddy' Day! Now get the latest market action report from  Douglas  and Jani . --- Accepting KIVA gift certificates to help support the work on this blog. All certificates gifted are converted into loans for those who need the help more. Follow Me on Twitter Dr. Declan Fallon is the Senior Market Technician and Community Director for Zignals.com , and Product Development Manager for ActivateClients.com . You can read what others are saying about Zignals on Investimonials.com . JOIN ZIGNALS TODAY - IT'S FREE!

Recovery Continues on Weak Volume

Image
A solid gain continued the development of swing lows in the various indices. Today's gains effectively confirmed the support levels for these lows. The Nasdaq had the best of the action with the swing low forming above 4800 breakout support.  The index is about to close the  breakdown gap from Tuesday, but first it has to contend with the 20-day MA. Shorts may view this is as an opportunity, although technicals point to mild weakness.

Bull Trap in Russell 2000

Image
What was on offer for bulls yesterday, was delivered today with the 'bear trap' in the Russell 2000. The bounce also occurred off the 50-day MA; an additional confirmation for a swing low. This is good news for bulls looking for a continuation of the broader rally, as it marks cyclical strength.

Decline Slows

Image
Yesterday's selling continued into today, but there was limited follow through downside in the indices. Selling volume in the S&P was down on yesterday, although there was no clear price support.

Further Selling Across The Board

Image
A tough day for bulls, a day which hurt Large Caps more than any other index. The S&P cut deep below 2064. It looks good for a push back to the 200-day MA, which is just above 1,988 support.  Volume climbed to register as distribution.

Semiconductor Index digs in at 20-day MA

Image
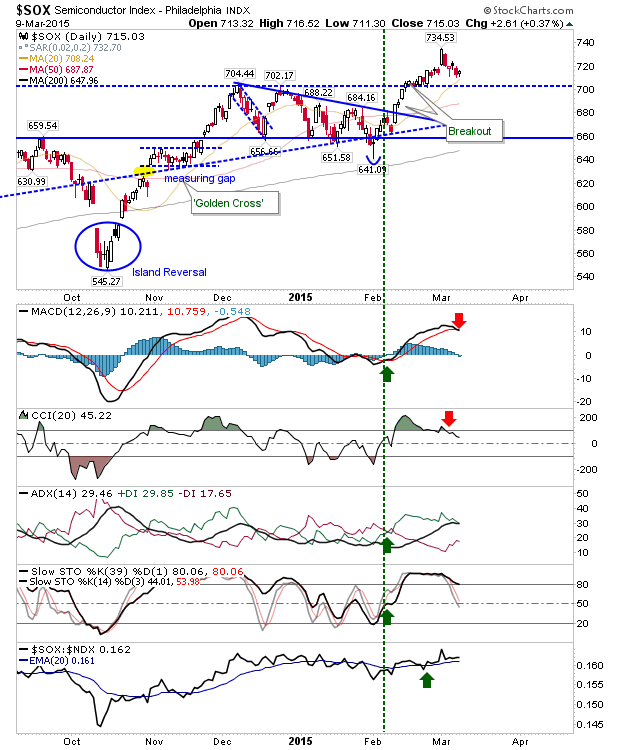
A modest recovery in markets likely helped bears more than bulls, although indices didn't recover enough to offer bulls anything more than a respite. The exception was the semiconductor index; it finished just above its 20-day MA, which is above 700 breakout support. It flashed a MACD trigger 'sell', which may expand om weakness tomorrow, but the daily chart is looking very good for bulls.

'Bull Traps' in Dow and S&P

Image
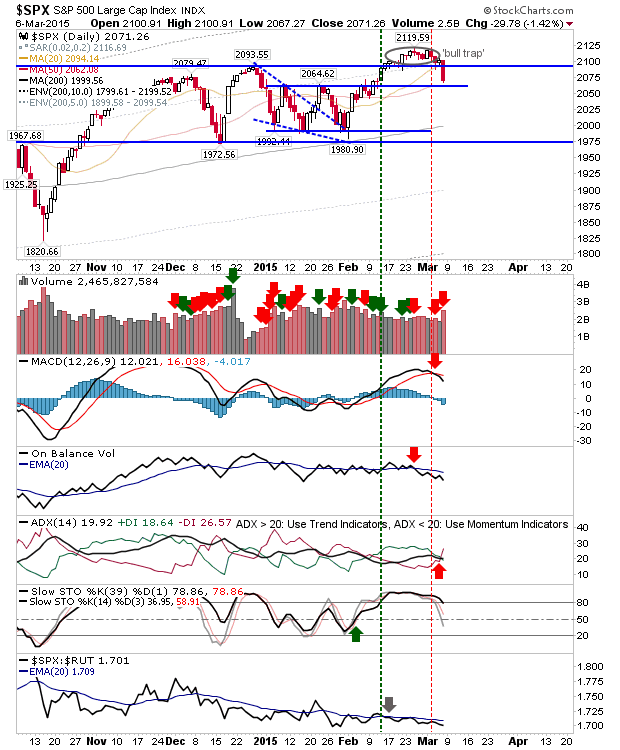
Friday was the first real move bears have successfully pulled off in recent weeks, at least for the S&P and Dow. In the case of the S&P, there was a decisive undercut of 2093 and 20-day MA, with the index finishing just 9 points above its 50-day MA. As the latter moving averages offered little in the way of support in January or February, the likelihood it that we will see another challenge on the 200-day MA. Volume climbed to register a confirmed distribution day, and came with a technical bearish cross between -DI and +DI. Any rally back to 2093 will likely get shorted on Monday.

S&P Maintains Breakout on Successful 20-day MA Test

Image
Another day, another successful defense of breakout support. The S&P held on to its 20-day MA and is well placed to bounce of this moving average tomorrow. Volume was down, which for a higher close was maybe a little disappointing.

Close to an Inflection point for S&P

Image
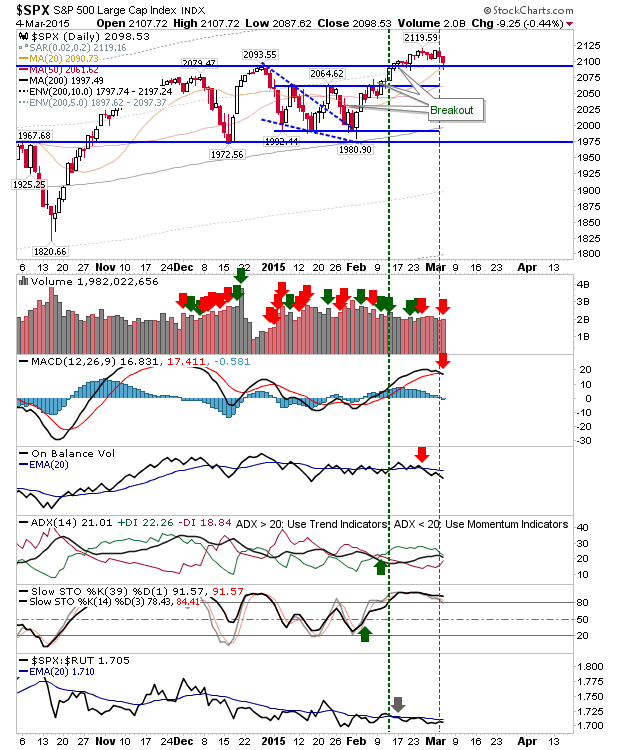
A second day of losses brought markets closer to support, and a potential decision point. The S&P tagged support at 2094 and the 20-day MA at 2090. Bulls will need to step up to the plate tomorrow if such key support is to hold. Lose 2093 and 2064 comes into play. Volume climbed today to register as distribution.

Bears Scratch The Market

Image
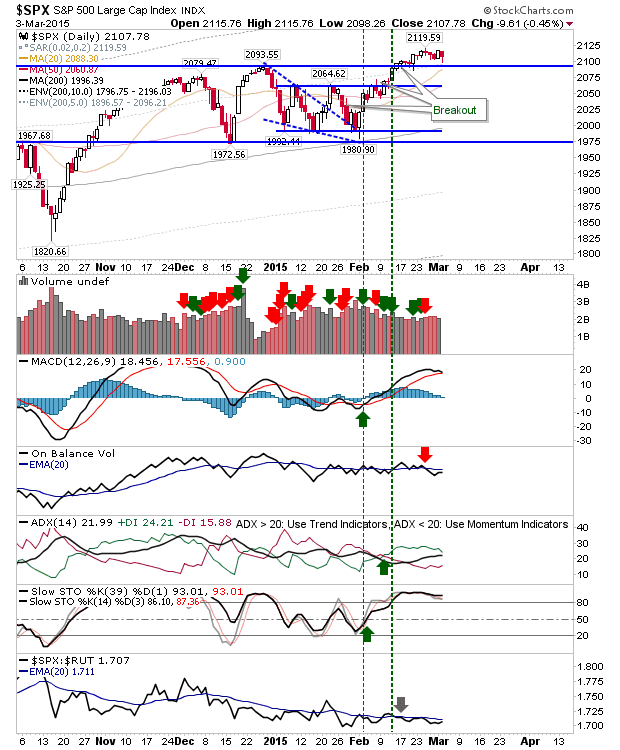
It was looking good for bears, until the late recovery put a bit of a gloss on proceedings. The first half hour of trading (and premarket) will be important tomorrow. The S&P is trading close to breakout support, and the 20-day MA is fast approaching to lend a hand. If bears were able to break both these levels it would open up for some downside. Although, fresh support would quickly emerge at converged 2064 support and the 50-day MA, but beyond that there is room down to 2000/1990.

Solid gains, especially for the Semiconductor Index

Image
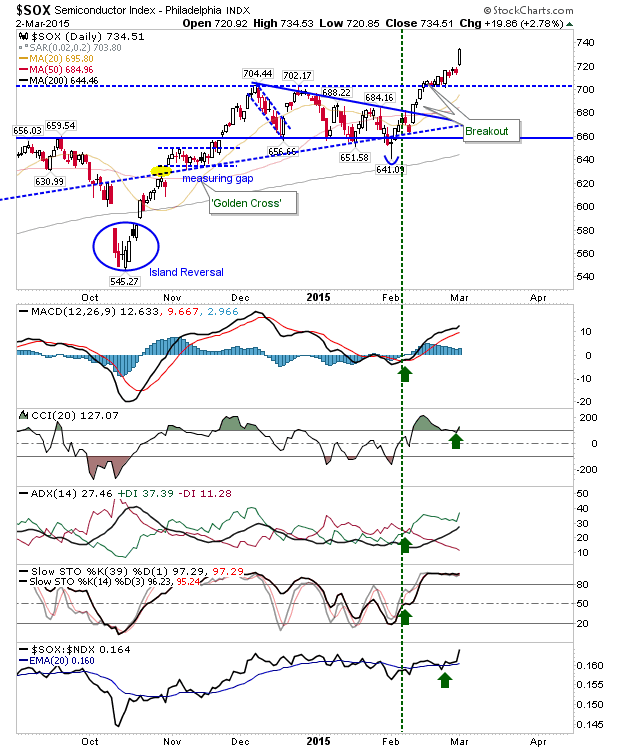
It was another good day for indices, but it was left to the Semiconductor Index to drive the biggest gain of the day. This is good news for Nasdaq and Nasdaq 100 bulls. The measured move target for this leg is 800.

Light selling, but not enough to threaten breakouts

Image
Friday's GDP data didn't rock the boat too much, and by the close losses were light and inline with profit taking. The only warning sign was a 'sell' trigger in the Nasdaq Percentage of Stocks Above the 50-day MA. Unusual in that the Nasdaq has been the high flyer of the indices in recent weeks. Breadth metrics for the Nasdaq need to be watched closely should such weakness expand.

Archive

Show more