Posts

Showing posts from March, 2022

Low volume selling after Russell 2000 breakout
Image
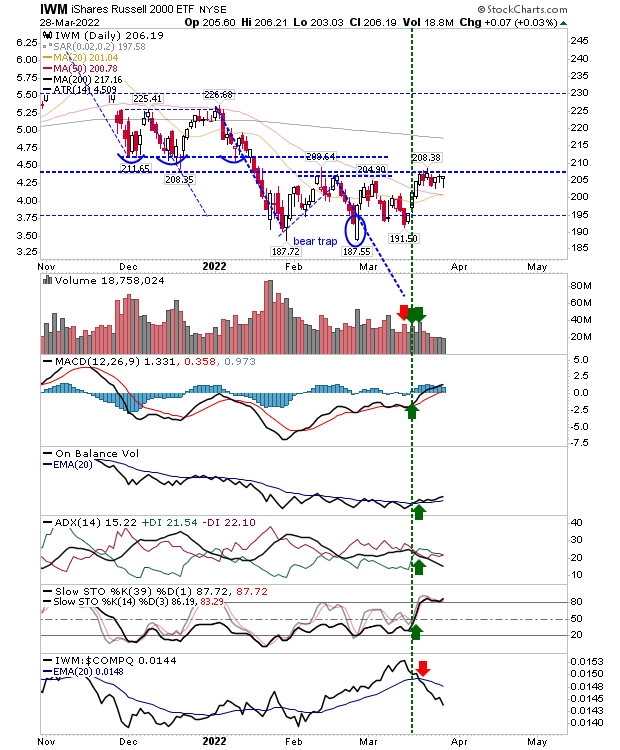
Yesterday finally delivered the long awaited breakout in the Russell 2000 on higher volume accumulation.  Today saw some low key selling on lighter volume, but the selling was not accompanied by distribution. The Nasdaq still offers net bullish technicals, but today's selling kicked in on the test of its 200-day MA. Yesterday's buying did count for accumulation. 

Russell 2000 is ready to breakout

Image
Another day passes with the Russell 2000 primed to breakout.  Today saw another small bullish 'hammer' just below resistance even as relative performance against the Nasdaq and S&P continued to plummet.  Buying volume was light, so this is an index biding its time until it's again noticed. 

The Mini-Bounce Continues Across Indices

Image
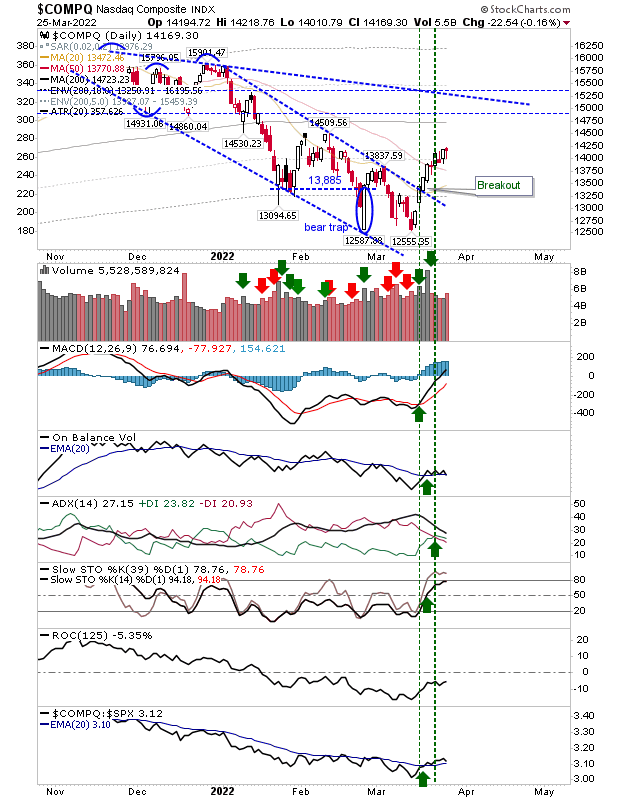
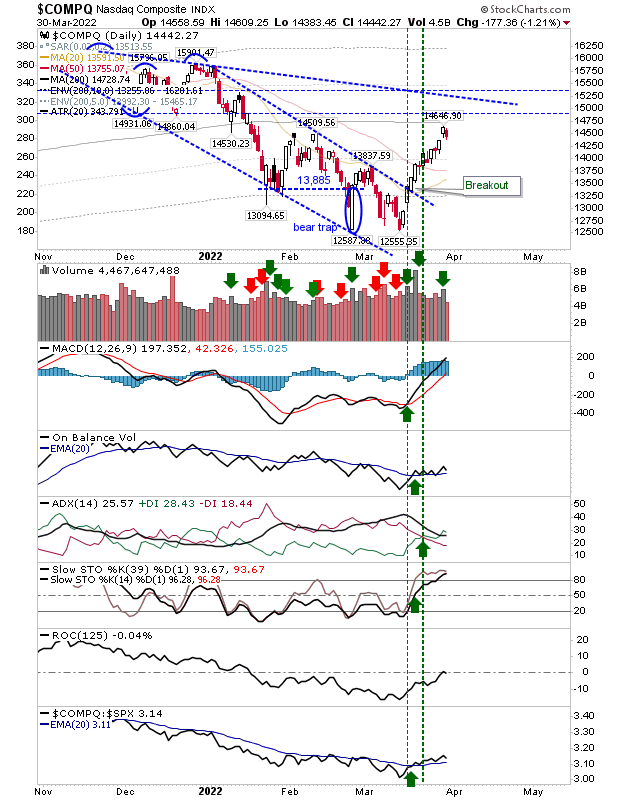
Friday was a relatively low key day, but there can't be many shorts left in the market after the rally from lows enters its third week.  I would like to see some downside just to gauge the level of demand from where there was a failed rally in early March.  Technicals remain vulnerable but do side with bulls. In the case of the Nasdaq, I would like to see a move back to test 13,250, but if there is a surge past 14,500 then I would look to the latter as new support.  The 200-day MA at 14,725 could also have a say in this rally.  Certainly, bulls were happy to buy 12,500 and it seems that particular low is here to stay for the forseeable future. There is good strength in Stochastics and the MACD, with the index outperforming the S&P - so Tech stocks should continue to attract investment. 

Pause in Buying as Indices Give Back Yesterday's Gains

Image
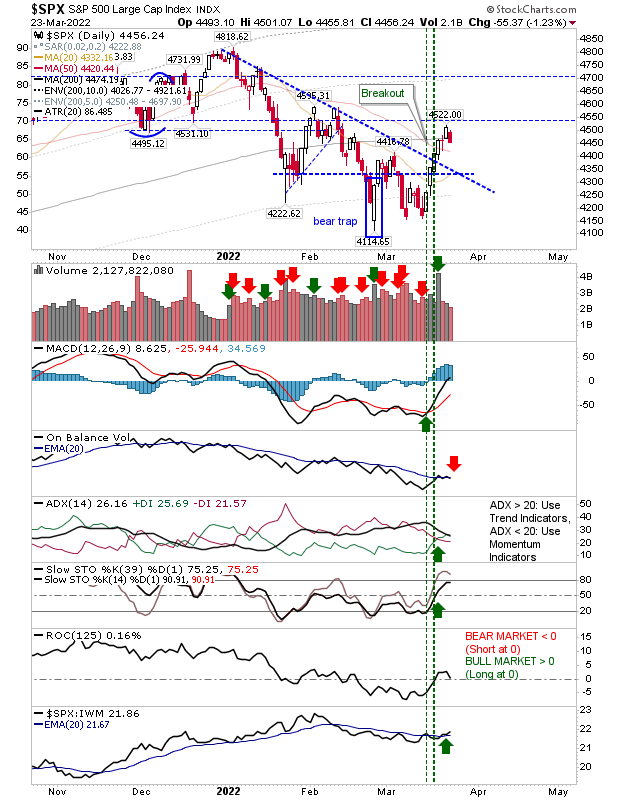
Markets returned most of the ground gained yesterday in what could be the start of the next pull back.  The percentage loss may have made some headlines, but the damage to the charts was relatievly minor. The S&P edged just below the 200-day MA with a 'sell' trigger in On-Balance-Volume. If the selling continues I would be looking for a test of former declining resistance - now support, which is also close to its 20-day MA. 

Rallies Continue Across Markets

Image
After yesterday's brief pause, today was a return to normal service (for bulls).  The Nasdaq pushed through its 50-day MA, although buying volume did not register as accumulation. However, On-Balance-Volume is building off a 'buy' territory.  In addition to getting past its 50-day MA it also took out the March swing high. The index is outperforming the S&P as part of this move. 

Tech and Large Cap Markets Make Early Running

Image
The Nasdaq and S&P both made strong recoveries from their last stand against February lows.  What was looking a slam dunk for a big move lower has instead turned into a four day rally which broke through resistance.  Friday's gains coincided with options expiration which clouded accumulation volume. The gains in the Nasdaq took the index to 50-day MA resistance. It would not be surprising to see one or two days of weakness from here, but we now have the benefit of new 'buy' triggers in the MACD, On-Balance-Volume and mid-line Stochastics, not to mention the relative performance gain over the S&P.  After what had looked a grim outlook for the index, this appears to have turned the corner.

S&P and Nasdaq Set Up For Big Loss Tomorrow

Image
When I see markets edge back to a big reversal low, then the set up is for a panic collapse once the lows get taken out, which seems inevitable for the Nasdaq and S&P.  Tomorrow could be a rough day.  Bulls can try and cling on to the generally light volume in the selling to the lows.  In the case of the Nasdaq, all technicals are negative and an already weak relative performance is accelerating lower.  February was a 'death cross' between 50-day and 200-day MAs and this is marking the long term trend lower. 

Bullish reversals, but markets not out of the woods.

Image
Just as the selling meant indices were not as weak as headlines suggested. Likewise, today's buying was not as good as the media would suggest either. However, it did at least stall the break of the most recent swing low. The Nasdaq has made its way back to declining resistance of the slow forming wedge, but technicals are all bearish and it remains some way from a bullish 'buy' in relative performance to peer indices.

Not strong enough...

Image
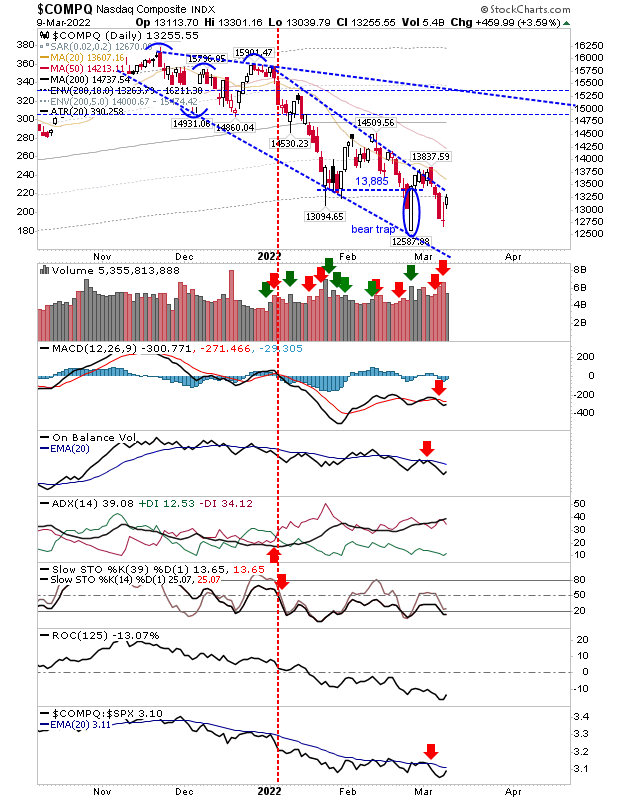
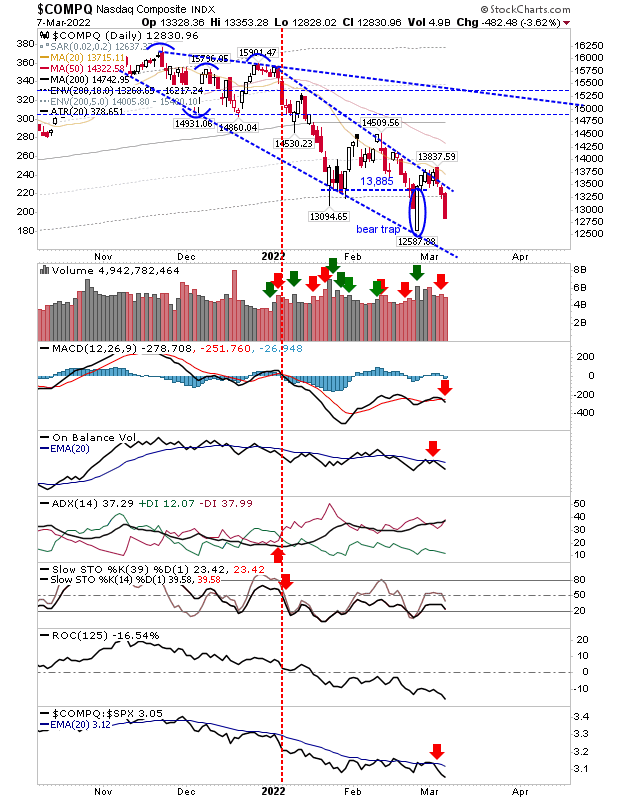
So the market has spoken and the selling continues. Whatever defense traders were able to mount on Friday was swiftly taken out on Monday.  However, the Russell 2000 again came out looking the best. Hardest hit was the Nasdaq as it lost 3.6% in a clear push into the large white candlestick marking the Feburary swing low reversal.  Today's selling came with a return 'sell' trigger in the MACD to go with existing 'sell' triggers in other technicals.  Relative performance took a large tick lower.  The only salvation for bulls was the lower volume; despite the big price loss there was no confirmed distribution. 

Now, we will see how strong the late February reversal is

Image
After the big surge off February lows on higher volume accumulation.  Now, we will see how robust such demand is with markets edging back towards February lows.  The Nasdaq is looking the most vulnerable as it has already cut below support which defined the 'bear trap'.  The breach was relatively minor from a price perspective, but it did come with a higher volume distribution and a 'sell' trigger in On-Balance-Volume.  Relative performance took a sharp tick lower. Again it's early days and the bullish reversal is not immediately at risk here. 

Getting closer to a market bottom

Image
The longer indices remain off their lows, the greater the probability those lows will become *the* low for the November-March decline. Again, focus should remain on the Russell 2000, which had suffered the largest relative loss over the course of 2021 but now finds itself in a leadership role in 2022 - despite the losses it experienced from November highs.  The Russell 2000 made further gains today as it pushes towards a cluster of resistance between $208-211 ($IWM), which also includes the 50-day MA.  Get past that, with the help of a MACD and On-Balance-Volume trigger 'buy', then we are looking at the 200-day MA and the start of a new base pattern (with a neckline marked by the November high). 

Archive

Show more