Posts

Showing posts from July, 2012

Desiring Cellulite? $CYNO

My latest Motley Fool post on Cynosure ($CYNO) is live .

Daily Market Commentary: Higher Volume Selling

Image
There was a registered a distribution day across key markets, but the distribution had more to do with Monday's light trading rather than Tuesday's heavier selling.  The loss in price was mild and fit with a orderly pull-back, maintaining the consolidation begun after last week's late gains.  Little else to add but just the charts: Follow Me on Twitter Dr. Declan Fallon is the Senior Market Technician and Community Director for Zignals.com . I offer a range of stock trading strategies for global markets which can be Previewed for Free with delayed trade signals. You can also view the top-10 best trading strategies for the US, UK, Europe and Rest-of-the-World in the Trading Strategy Marketplace Leaderboard. The Leaderboard also supports advanced search capability so you can tailor your strategies to suit your individual requirements. Zignals offers a full suite of FREE financial services including price and fundamental stock alerts , stock charts for

Daily Market Commentary: Quiet Day

Image
Very little to add on today's action.  Markets traded slightly down on light volume. Friday's technical improvement is clear in all charts. The Nasdaq is stuck under declining resistance with On-Balance-Volume dithering around a potential 'sell' trigger. While the Russell 2000 is effectively range bound, above key 50-day and 200-day MAs, but below the 20-day MA. The only real point of note was the net bullish turn in technicals for the semiconductor index. The 390 line is the breakout point Tomorrow will probably be more of the same, but with the improvement in semiconductors there is a good chance the Nasdaq will get to see best of the gains. --- Follow Me on Twitter Dr. Declan Fallon is the Senior Market Technician and Community Director for Zignals.com . I offer a range of stock trading strategies for global markets which can be Previewed for Free with delayed trade signals. You can also view the top-10 best trading strategies for the

Latest Portfolio Management Jobs

Some of the Portfolio Manager related jobs available: Commodities Portfolio Manager/Sr Analyst Senior Portfolio Management Officer VP Sr. Portfolio Manager Managing Director, Portfolio Manager, Fixed Income, Portfolio Management Group Associate, Portfolio Management Associate Portfolio Management Portfolio Relationship Manager Portfolio Administrator - Wealth Management Trader / Portfolio Manager Portfolio Manager Carryover jobs from last week US Equity Finance Trader Entry-Level Equities Trader Multi-Discplined Equity Trader Junior Equity Trade r Experienced Equity Options Trader Equity Sales Trader Institutional Equity Sales Trader Associate Portfolio Manager/Trader - Fixed Income High Yield Equities Trader Experienced Associate Investment Banking-Chicago, IL or Milwaukee, WI Algorithmic Trader Proprietary Equity Trader Subscribe to Trading Jobs by Email

Weekly Market Commentary: Comprehensive Breadth Recovery

Image
Market Breadth continued its improvement on the weekly time frame.  The April low is playing out as a major swing low for breadth and the rally from this low still looks to offer further upside. The Percentage of Nasdaq Stocks Above the 50-day MA is net bullish (technically) with 59% of Nasdaq stocks above their 50-day MA.  Plenty of room for upside. The Nasdaq Bullish Percents had a more low key week. Technicals for this instrument are still net bearish. The April low hasn't followed through yet. While the Nasdaq Summation Index bucked the trend by closing down last week, although the April swing low is clear and technicals are net bullish. The improvement in Nasdaq breadth has nicely shaped the parent index.  There is a clear 'handle' forming above 2,885 with the spike lows into 2,800 over the past few weeks indicating demand.  Below this is a good place for stops on long positions.  Technicals net bearish but improving. The S&P had an interest

Daily Market Commentary: Powerful Rally

Image
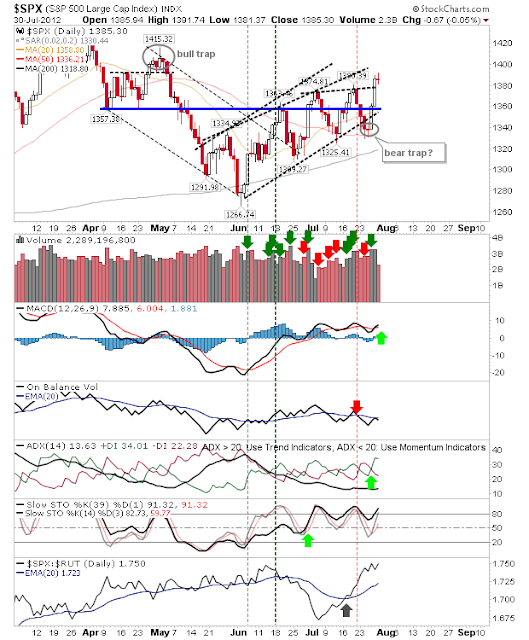
The bulk of the gains were achieved at the open, but it was a good day for bulls who applied pressure to shorts acting on the break of the channel - leaving behind a 'bear trap'. The S&P offered a good example with the 50-day MA playing as support. Today's rally regained former channel support and inched above the breakout line defined by the April swing low. The rally in the Nasdaq achieved a little more; it finished yesterday below the 50-day MA but managed to regain both it and channel support today. Bulls may find more on offer tomorrow. Although Nasdaq breadth is under pressure with a net bearish turn in technicals for the Nasdaq Bullish Percents Small Caps just about regained the 50-day and 200-day MA on what was a relatively flat day (doji); 764 key support and place for stops if a buyer. Friday offers bulls a chance to push their advantage.  Today's 'bear traps' are the first step, but there is a chance for more tomorrow.  Stops

Daily Market Commentary: Stall in Decline

Image
What stood yesterday, held today. One of the exceptions was the Nasdaq 100 which undercut the 50-day MA, but the prior swing low from early July held.  Technicals continued to decline. On the other hand, the Dow was able to mount a small rally, gaining 58 points from working off its 50-day MA.  It also saw an uptick in relative strength to the Nasdaq 100, reflecting a flight to safety.  Volume was considerably lighter, which in itself is a warning sign suggesting the 50-day MA is not major support. The Semiconductor Index was another index to benefit which rallied, but got stuck at its 50-day MA.  Another gain in the next few days to take it past the 50-day MA will set up the 200-day MA as a target. The rally in the semiconductor index may provide the impetus for a move higher in the Nasdaq.  Today's loss confirmed a channel break, but a rally Thursday sets up the potential for a 'bear trap'. Tomorrow is set up for a gain.  Any gain which re-establishes

Daily Market Commentary: Selling Continues

Image
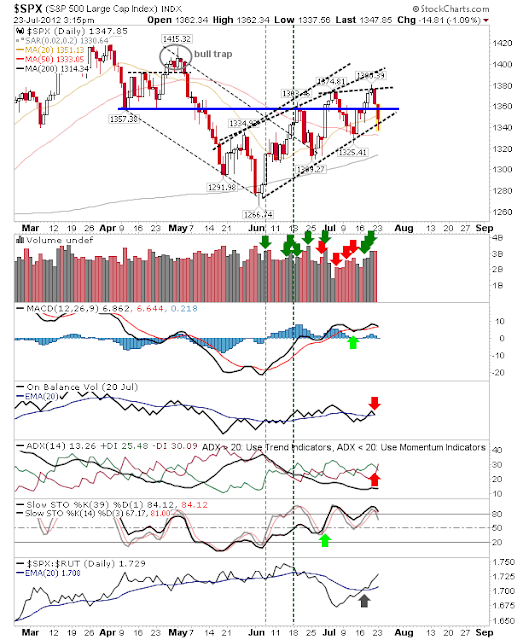
With the Russell 2000 offer a precedent with a new lower low it went one step further with breaks of 50-day and 200-day MAs.  Technicals continued to deteriorate with a net bearish turn likely to happen over the next  couple of days.  However, the index did manage to finish the day with a back test of former declining resistance defined by March / April swing highs. The S&P lost rising support of its channel but managed to hold on to its 50-day MA despite the higher volume selling (distribution). The Nasdaq also had a tight call.  Tuesday's selling finished a shade below its 50-day MA and channel support, but is close enough to see an early morning rally regain this support. Technicals are a similar poor shape as the S&P with bearish 'sell' triggers in the MACD, On-Balance-Volume and Directional Index. With today's weakness there is a decent opportunity for a rally to regain some of the momentum lost from last week.  The overall outlook is more be

Daily Market Commentary: Weakening Rallies

Image
A little early for this update as I recover from jet-lag.  The market isn't much different to where I last left it at the start of July. The key difference is each rally peak is become more shallow as swing lows ascend; this squeeze will eventually break - most likely to the downside. Weakness in the S&P is also showing itself in a squeeze in technical strength; the bearish cross in +DI/-DI and On-Balance-Volume with a pending 'sell' in the MACD suggest the June rally is about to come to an end. Selling is harder in the Nasdaq as the most recent swing high was below the prior peak; the MACD is also on a 'sell' trigger as the index (so far) successfully defends the 50-day MA.  There was also a rebuttal off horizontal resistance just below 3,000. Nasdaq Breadth has also taken a hit as the Percentage of Nasdaq Stocks above their 50-day MA drops. The smoother moving Summation Index is also in the process of rolling over in favour of Bears. The

Current Trading Jobs

Quiet month for summer, but here are some of the latest Trading and Trading related Jobs. US Equity Finance Trader Entry-Level Equities Trader Multi-Discplined Equity Trader Junior Equity Trade r Experienced Equity Options Trader Equity Sales Trader Institutional Equity Sales Trader Associate Portfolio Manager/Trader - Fixed Income High Yield Equities Trader Experienced Associate Investment Banking-Chicago, IL or Milwaukee, WI Algorithmic Trader Proprietary Equity Trader Subscribe to Trading Jobs by Email

Daily Market Commentary: Very Low Volume Gain

Image
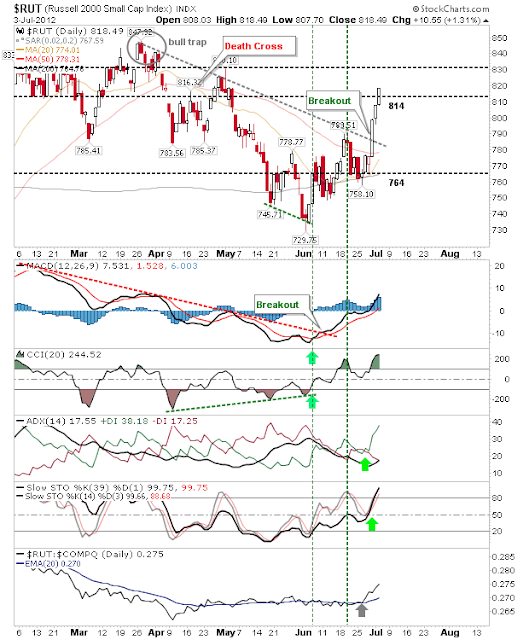
In one of the lowest volume trading days of the year markets traded yet another higher close. I don't expect the remainder of the week to be any different.  I'll be on vacation and computer-free for the next couple of weeks so updates will be limited to Twitter . The Russell 2000 continued to play lead charger and comfortably cleared minor resistance at 814. Tuesday also saw breakouts for the Nasdaq 100: And Semiconductor index If these breakouts can hold Monday it will keep attracting money from the sidelines as the July low becomes a more substantial swing low. ---- Follow Me on Twitter Dr. Declan Fallon is the Senior Market Technician and Community Director for Zignals.com . I offer a range of stock trading strategies for global markets which can be Previewed for Free with delayed trade signals. You can also view the top-10 best trading strategies for the US, UK, Europe and Rest-of-the-World in the Trading Strategy Marketplace Leaderboard. The L

Daily Market Commentary: Consolidation

Image
Given the July 4th holiday sits bang in the middle of this week and traders are likely to extend the holiday into the weekend it would appear unlikely for any big move to emerge this week (assuming Europe doesn't throw a wobbler). Yesterday played to this form: A modest gain on light volume, but more importantly holds Friday's gains. The S&P shows a net bullish picture. Along with the Nasdaq; yesterday's small gain was actually the breakout Although the semiconductor index will need some of this mojo to regain the 200-day MA. It's struggling a little, but has done well to negate what looked a certain 'bull trap'.  Technicals continue to improve and are net bullish. The best news was saved for the Russell 2000. This key 'bull market' index enjoyed a solid 1%+ gain and has been the leading index in the late June push; note the sharp rise in relative strength to the Nasdaq.  This is good news for those looking for this rally to continue

Battle of the Towers

My latest Motley Fool post covers SBA Communications (SBAC), American Tower Corporation (AMT) and Crown Castle International (CCI). My earlier posts are available from a feed here .

July Trading Jobs

This week's trading jobs include: Associate Portfolio Manager / Trader Experienced Options Trader Senior Trader, NTSI Equity Options Trader Associate Portfolio Manager - Fixed Income High Yield Equities Trader Experienced Associate Investment Banking Experienced Associate Investment Banking Experienced Financial Services Representative Algorithmic Trader Junior Equity Trader Junior Java Developer - FX Autotrader Team Equities Trader Proprietary Equity Trader Junior Equity Trader Multi-Discplined Equity Trader Entry-Level Equities Trader US Equity Finance Trader Institutional Trader - Equity & Options Equity/Option Trader - Institutional Services Entry Level Trader Subscribe to Trading Jobs by Email

Weekly Market Commentary: Middling Breadth

Image
Last week's strong finish left markets nicely positioned on the bullish side, but with room to maneuver before things get too hot. The Percentage of Nasdaq Stocks above the 50-day MA turned net bullish as it climbed above the 50% level. The slower moving Nasdaq Summation Index hasn't yet turned net bullish, but is in the process of creating a swing low. The only concern is the Bullish Percents, which have been slow to turn. However, the Nasdaq is back threatening the bull trap, but there is still 200 points of ground to make up before it can put this bearish supply behind. The S&P is still toying with former channel support turned resistance, but is at least heading in the right direction. However, it's only on the verge of channeling its 'bull trap'; big week ahead for the index. The Russell 2000 is also in the process of challenging prior supply from the head-and-shoulder pattern with new multi-year highs in range. If the bull market

Archive

Show more