Posts

Showing posts from April, 2013

Daily Market Commentary: Significant Accumulation
Image
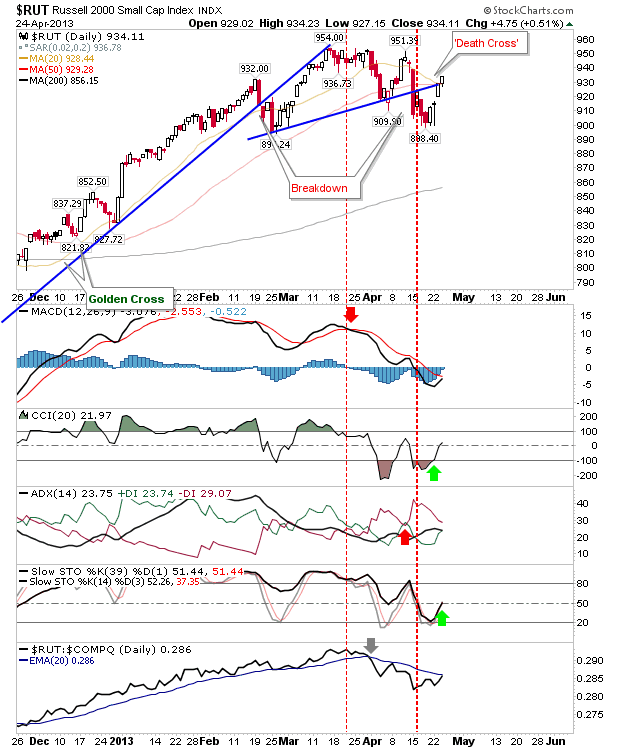
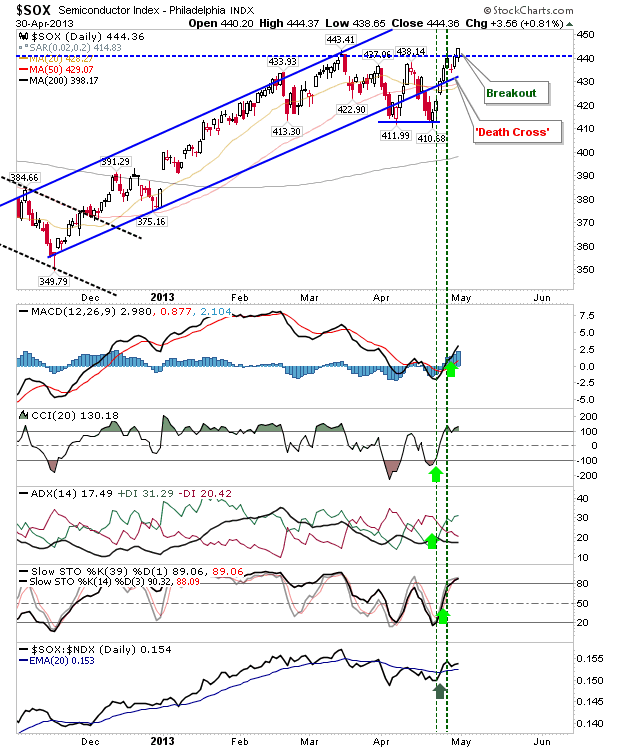
Technology spent another day in the headlines.  Yesterday there was a breakout in the Nasdaq, now today there was heavier volume buying to back it up. The semiconductor index is the 'news' index to follow.  It's breakout will largely determine how long the rallies in the Nasdaq and Nasdaq 100. Technicals are net bullish, another tick in the bullish column for these indices. Even the 'Death Cross' might not last too long.

Daily Market Commentary: Tech Breakout

Image
While volume was anemic, Tech indices managed to push a breakout.  Technicals returned net bullish while the Nasdaq moved to outperform against the S&P. A 'bull trap' will be created on a close below 3,300.

Weekly Market Commentary: Breadth Swing Low

Image
While it's questionable the extent the breadth swing low will support for a rally in the parent Nasdaq (given none of the breadth indicators are oversold), it does suggest the current rally is something more than just a relief rally.

Daily Market Commentary: Impasse

Image
Some small gains, but nothing to suggest a follow through to the past three days of buying. Volume climbed to register an accumulation day, but it barely registered as one. The only real point of note was the finish above resistance and converged 20-day and 50-day MAs in the Russell 2000.

Daily Market Commentary: Tech Resistance Failed

Image
Yesterday's buying managed to bring Tech indices to former rising channel support, pushing them beyond resistance with relative ease.  This was supported by higher volume accumulation. So despite the weak Tech breadth, buying was able to continue. The Nasdaq 100 illustrated this best with the move to challenge the 'bull trap'.

Daily Market Commentary: Nasdaq 100 Net Bearish

Image
Bulls came to the rescue at support, but there was a general lack of conviction on the part of buyers to build something meaningful. The Nasdaq 100 turned net bearish technically, but the attempt at support has already pulled one indicator back. However, look for it to struggle at 2,825.

Daily Market Commentary: Tech Continues to Sell Off

Image
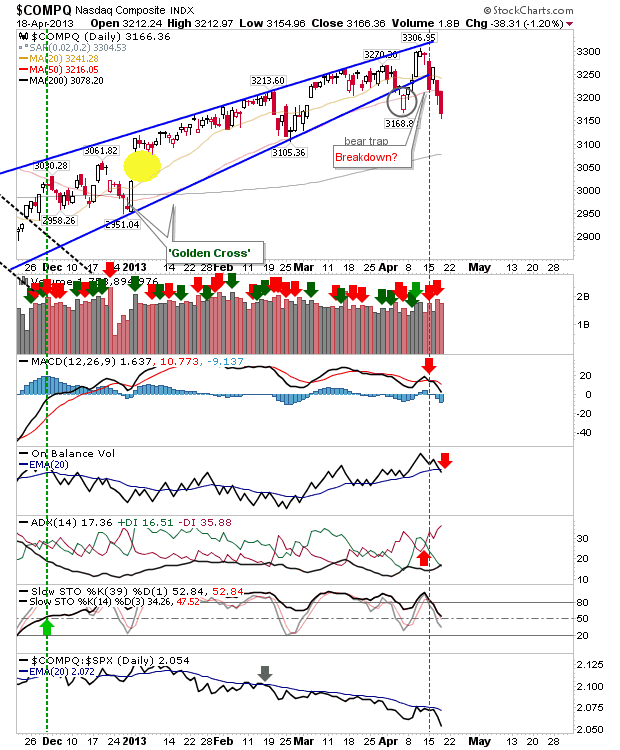
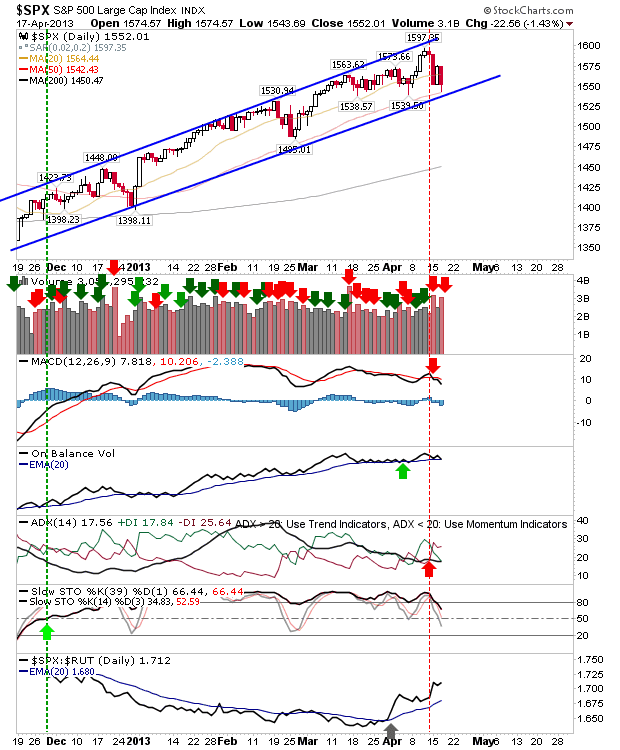
Sellers kept the pressure on, with Technology taking the brunt of it. The swing low (and former 'bear trap') from early April was knocked out. This leaves the Nasdaq's 200-day MA as the next target. The Nasdaq 100 also knocked out its swing low, but almost managed to make it to its 200-day MA. Look for other indices to do likewise.

Daily Market Commentary: Bears Win

Image
Yesterday's gains were undone by today's round of selling.  Volume climbed to register a second big distribution day in three as technicals remained under pressure. This selling doesn't look done. The S&P was able to defend its 50-day MA, which is in close proximity to rising channel support. However,  with similar support trashed in the Nasdaq and Russell 2000, it's going to be hard for the index to hold this support.

Daily Market Commentary: Low Volume Buying

Image
The rebound was decent, but lacked volume conviction. It didn't do enough to reverse the breakdown in the Russell 2000, but it did push the Nasdaq and Nasdaq 100 into a 50:50 situation. The Russell 2000 came back to the breakdown line, but finished below its 50-day MA. Technicals are close to a net bearish turn.

Daily Market Commentary: Bears Pounce

Image
It was a bad day at the office for bulls, but the selling hasn't totally handed control to the bears.  The swing lows are still defendable positions, although action in the Russell 2000 suggests these won't be defended very hard. The near 4% sell off in the Russell 2000 knocked out the swing low, with a clean slice of the 50-day MA to boot.  There is little to protect until the index gets down to its 200-day MA. What's most problematic is the role of the Russell 2000 as a trend leader, and this trend is clearly favouring bears (for Small Caps).  Look for Tech and Large Caps to follow - eventually.

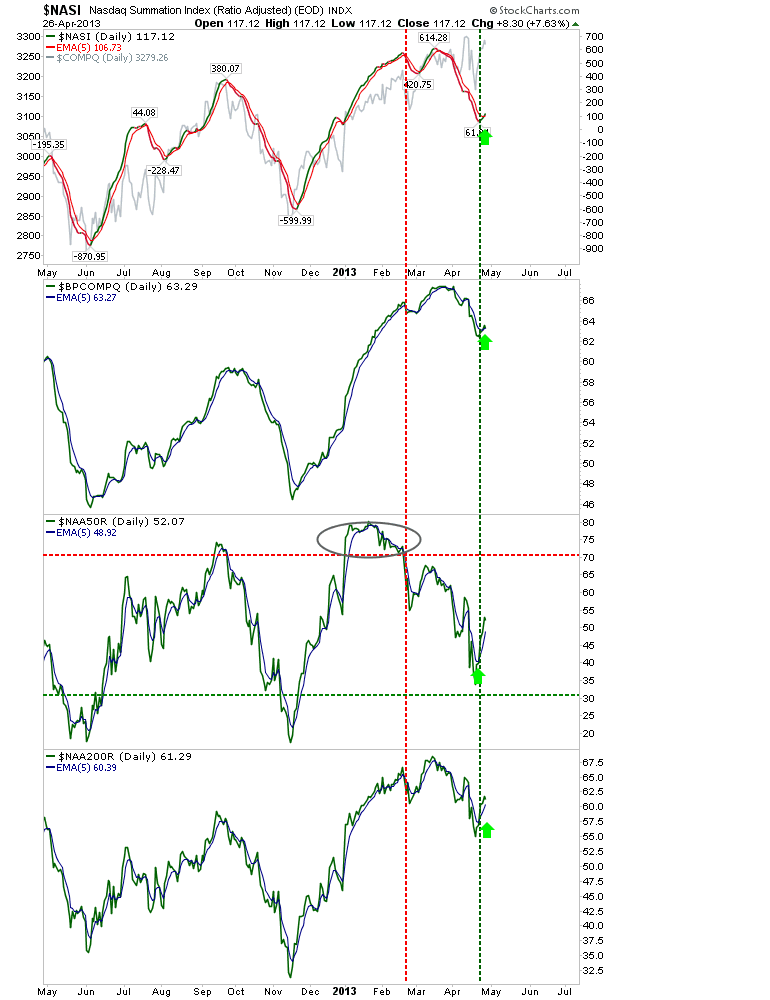
Weekly Market Commentary: Breadth Recovers, But Still Net Bearish

Image
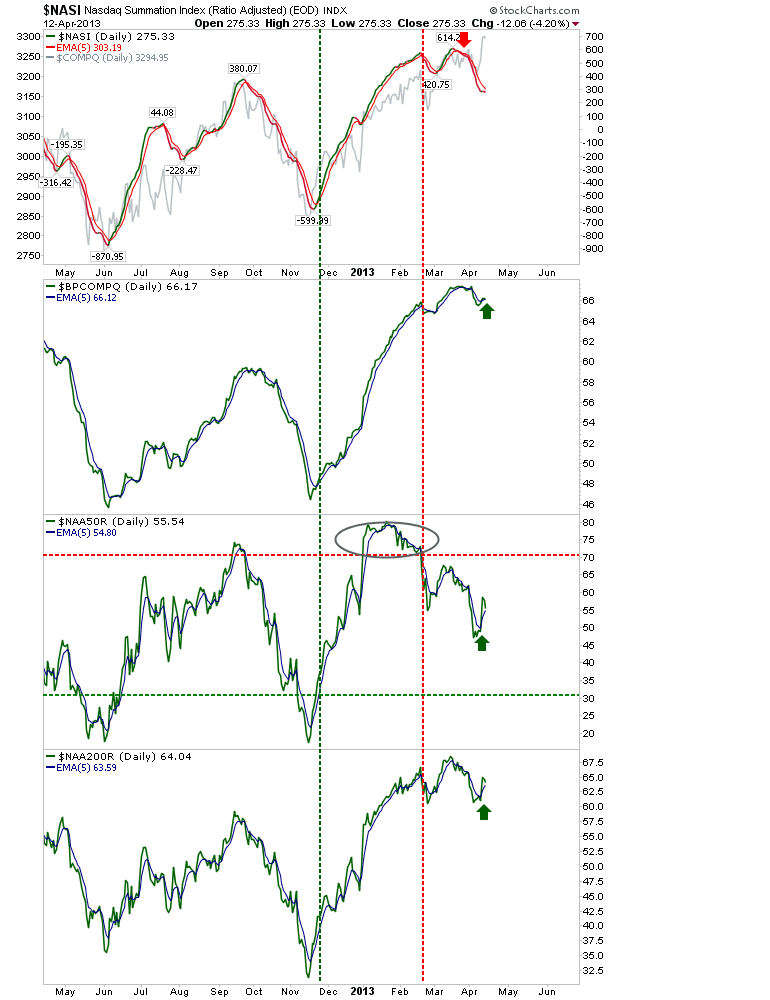
The Masters has me distracted, so I will just show two charts: The Nasdaq has had a very good run of form of late, but it hasn't really changed the breadth picture a great deal.  Bulls will look to the new swing low which will be confirmed if the Nasdaq Summation Index crosses above its 5-day EMA, and other breadth indicators hold their 5-day EMA.  Bears will see a dominant bearish trend, particularly in the Percentage of Stocks above the 50-day MA, and suggest the current run is nothing more than a relief rally.

Stock Picks: $THC, $NTES, $ISIS, $EQT, $CNP, $AA, $SWC, $JNJ, $MOV, $EL, $GWRE, $PDCE, $BLOX

A bit of a backlog on the posts, but here we go: Click links for fundamentals on THC, NTES and ISIS , EQT and CNP , AA and SWC , JNJ, MOV and EL , GWRE, PDCE and BLOX . --- Follow Me on Twitter Dr. Declan Fallon is the Senior Market Technician and Community Director for Zignals.com . You can read what others are saying about Zignals on Investimonials.com . JOIN ZIGNALS TODAY - IT'S FREE!

Daily Market Commentary: Small Gains

Image
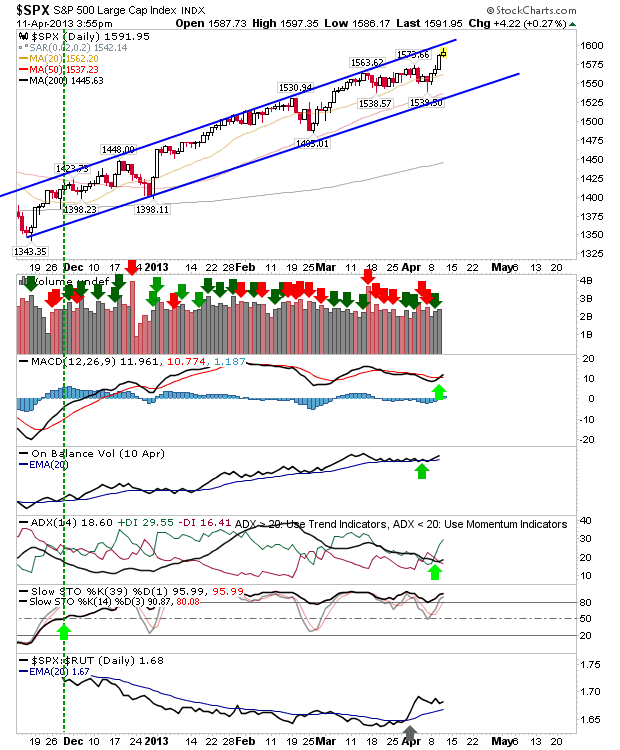
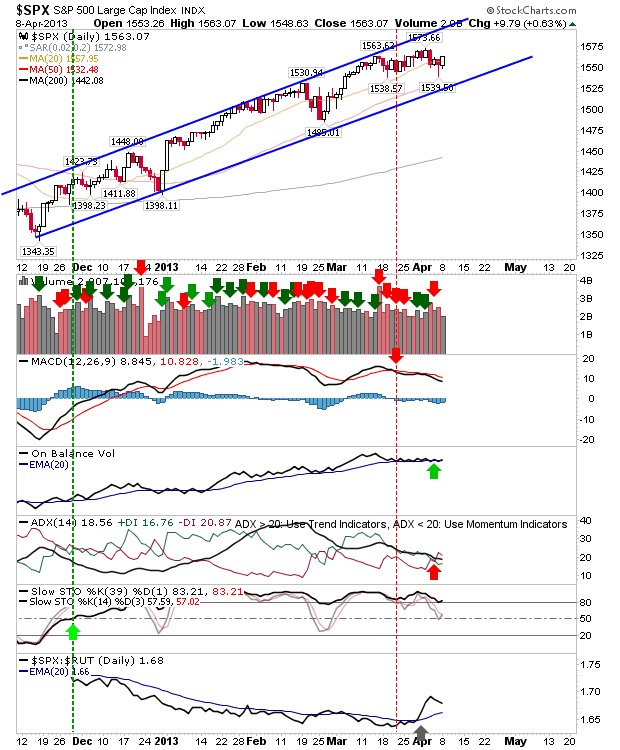
It was going to be hard to expect a good follow through from yesterday's buying, but today didn't disappoint with markets retaining most of the gains. The S&P even managed to finish with a modest gain. Enough to build on bullish technicals.

Daily Market Commentary: New Highs

Image
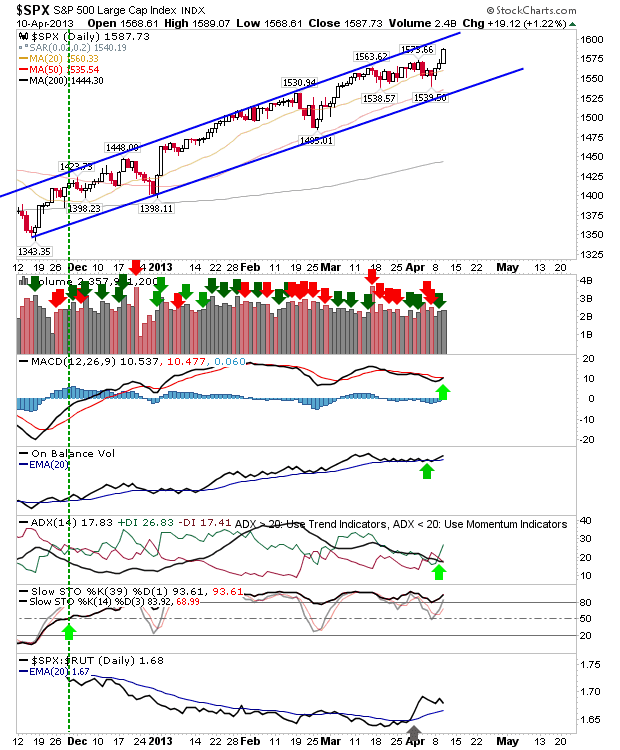
The 'Bear Traps' are playing to form with a substantial jump to help push new market highs. Volume picked up in support with some technical improvement.  Breadth is also attempting a swing low which will help support an extended rally in Tech indices. The S&P inched an accumulation day as it pushed a new high. There was also a MACD trigger 'buy' to negate what had been the only bearish indicator

Daily Market Commentary: Bear Traps in Tech Indices

Image
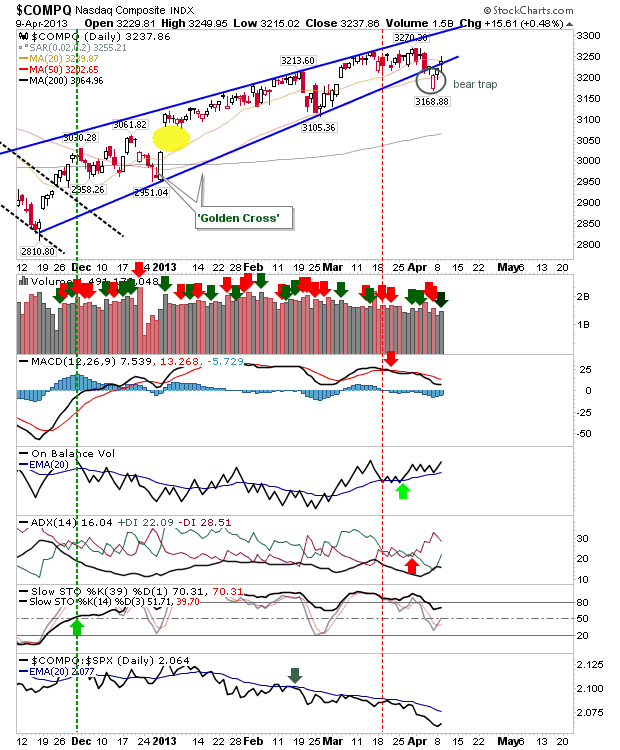
Bulls managed to mount a more substantial recovery than they have in recent days, to the extent tech indices were left with 'bear traps'. The Nasdaq finished on its 20-day MA, a potential point of attack for shorts. On-Balance-Volume has been rising, and is close to a new reaction high. Should this happen, a break of 3,270 become favoured. Other technicals remain bearish (at least for now).

Daily Market Commentary: Low Volume Recovery

Image
While it was a decent enough day on a point-win scale, it wasn't particularly robust on a volume basis. Markets have suffered two days of distribution in the last four, with a marked relative shift towards defensive Large Cap Stocks. Given this, any bounce which emerges may see Small Caps underperforming.

Daily Market Commentary: Modest Recovery

Image
There was some digging in of heels at support, but buying volume was light. The S&P held its 20-day MA. On-Balance-Volume switched back in favour of a 'buy', although this particular indicator is in whipsaw territory.

Daily Market Commentary: Selling Widens

Image
This time, there was no hiding from the selling as the S&P followed the lead of the Russell 2000 and headed lower. The semiconductor index was the big loser, breaking out of its channel after losing 50-day MA support. Technicals are net negative. The 200-day MA is next for support.

Daily Market Commentary: The Back & Forth Continues

Image
Yesterday's day of weakness was followed by a day of gain. However, there was one index which suffered a second day of losses in a row. The semiconductor index cut through its 50-day MA in a warning to Tech indices.  The semiconductor index is on the verge of becoming the first of my followed indices to turn net bearish technically.

Archive

Show more