Posts

Showing posts from August, 2015

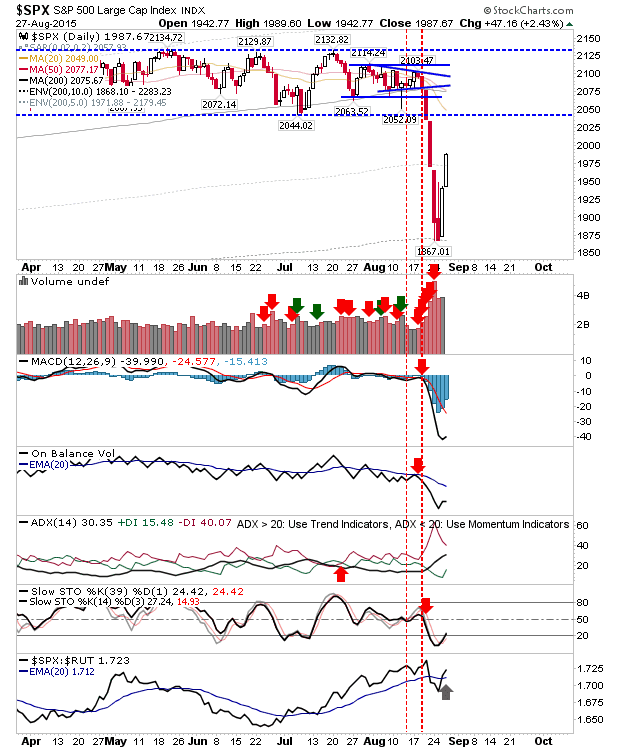
Modest Losses

Image
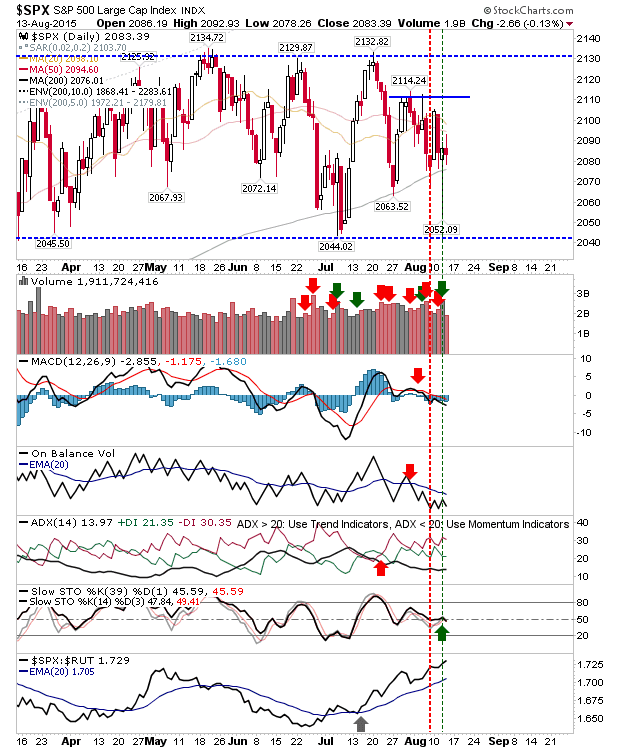
Bears took it upon themselves to press their advantage into the close of business. Selling volume was light and lacked the conviction that had accompanied the rout of the previous week. The S&P is caught in a no-mans land, with a retest of 1,867 likely needed at some stage to rebuild confidence on bulls.

Rally Stalls Out

Image
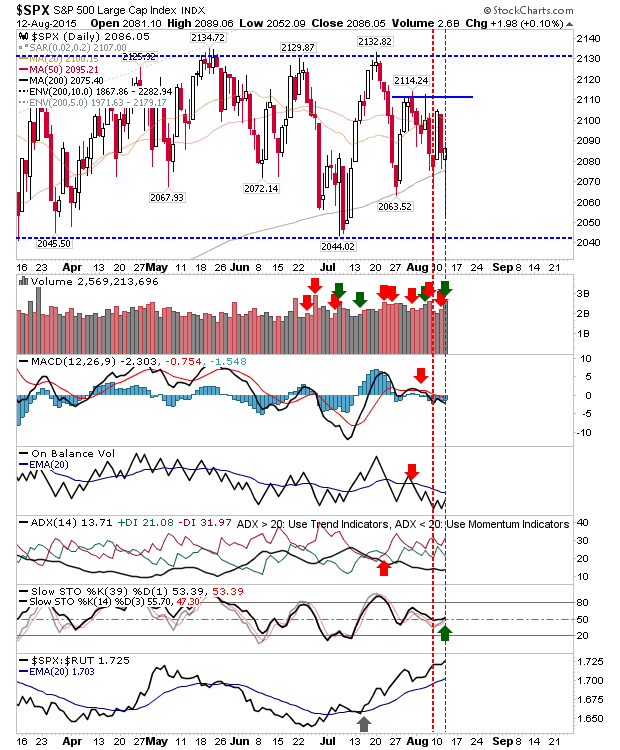
After all the volatility during the week, Friday's action was a little reprieve. Markets sit a point where shorts will fancy their chances, although further upside should not be viewed as surprising given the level of volatility markets experienced last week. If there is an indication bears are going to come back with a vengeance, it's that buying volume has been well down on prior selling. The Nasdaq finished on former trading range support, turned resistance. Watch for a short squeeze from this level, up to the 200-day MA.

Shorts Rally - But For How Long?

Image
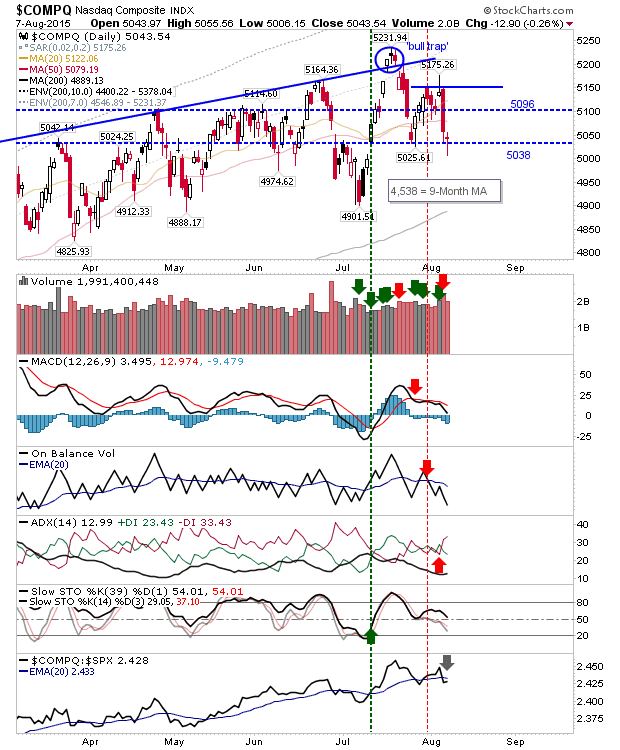
A second day of gains keeps pressure on shorts in squeezing them out of their positions, but is also looking to sucker shorts into trying to second guess when this rally will end. The S&P is heading fast towards 2,044. Given the speed at which it has enjoyed this advance it will be there by Tuesday! In reality, it will likely slow before it gets there. When markets do head lower it will be important they do so slowly to sow further doubt into shorts.

Selling Pummels Markets

Image
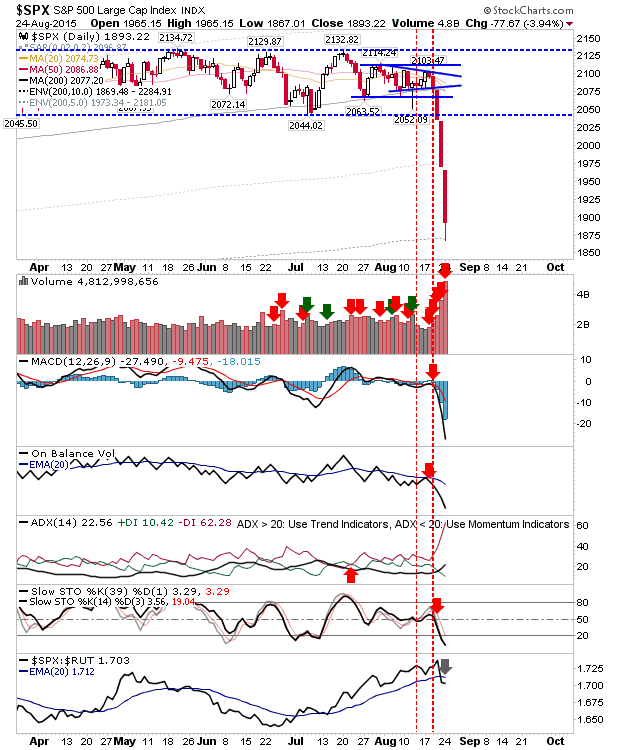
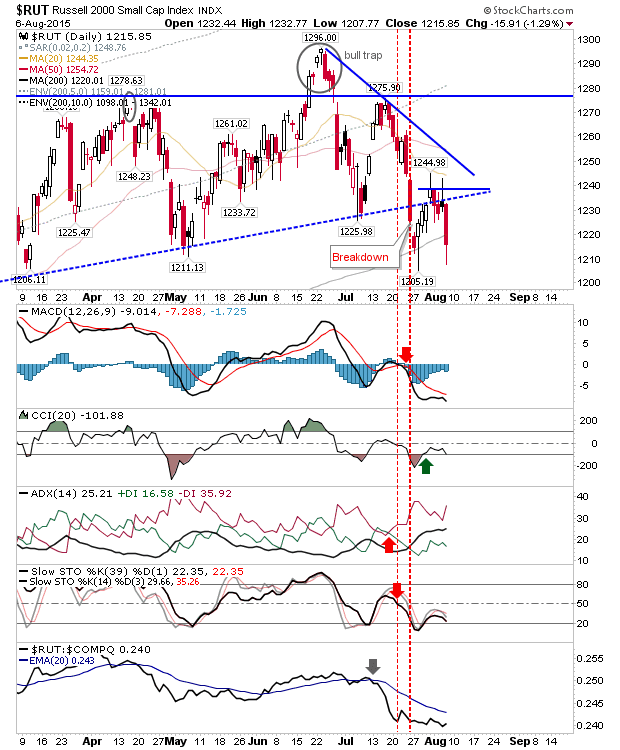
The third day of selling pushed markets deeper into oversold territory and potential long term 'buy' territory. In my 'bottom' tracker, the S&P is priced in the 90% zone (i.e. only 10% of historic prices relative to the 200-day MA have been worse), while the Nasdaq and Russell 2000 is in the 85% zone. It has been 4 years since markets have been this oversold. The S&P made a picture perfect tag of the 10%, 200-day Envelope. Although with trading restrictions in place at market open it would have been difficult to get a fill at this price. But now is a time to be shopping for value in individual stocks

Near Term Oversold, S&P and Russell 2000 in "Accumulate" Zone

Image
Friday's action washed out bulls and likely scared off any buy-the-dip players.  Longstanding trading ranges from 2015 were decisively breached on heavy volume. However, selling has reached a point where there is good chance of a rebound on Monday. Both the Russell 2000 and S&P reached the "Accumulate" marker, where long-term buyers can chase value in the market. The last time this scenario played for the S&P was November 2011, although it was October 2014 for the Russell 2000. The S&P tagged the 5% envelope band of 200-day MA, an area which will give bulls a chance to mount a snap back rally to the 200-day MA, and a place where long term buyers can look to buy value in the market.

Buyers Report Absence

Image
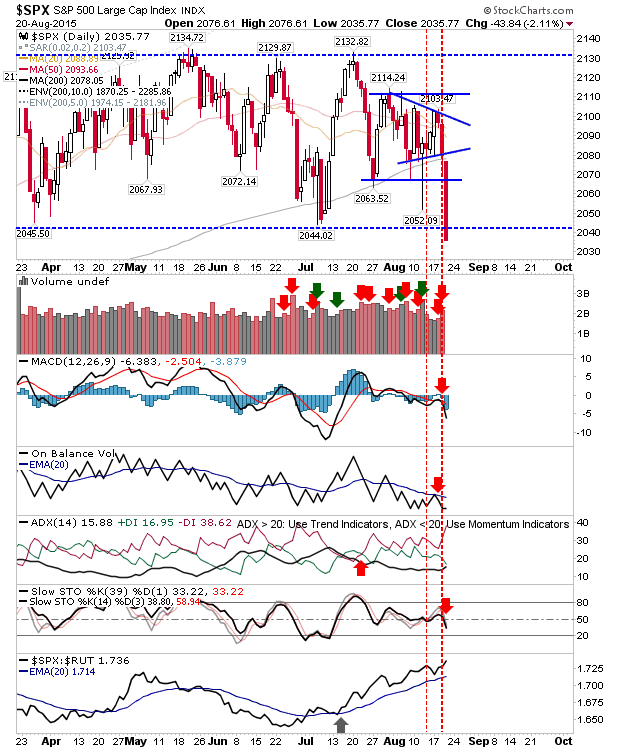
No denying who took control today. Buyers will have their work cut out if they are going to regain it. Today's dominant red candlestick will likely see some come back tomorrow, but eating back all of today's losses will be more difficult. The S&P lost over 2%, knocking out 2,045 support and returning all technicals into the red. Volume climbed as distribution. The 200-day MA is now the line on the sand for bulls. The loss is significant and will not be easily recovered.

Scrappy Day

Image
Tough day at the office with sellers having all of the fun until the Fed meeting minutes jacked up prices, only for sellers to return into the close. For the S&P, each test of the 200-day MA weakens it, and we are probably getting close to the point we get a decent push down, and a move outside of the longstanding trading range which has plagued this market throughout 2015. Even a modest 10% correction off highs would set it to drop below psychological 2000. Should such a move occur it should be welcomed like refreshing rain on a muggy day. The market needs direction. The Nasdaq dropped below 5,038, but 4,950 is key support - which is also close to where the 200-day MA is.  Still plenty of places for buyers to step in, and this is not looking as vulnerable as the S&P. The key disappointment for Tech was the loss of support from what had looked to have been a bullish wedge in the Semiconductor Index.  Technicals are again all net negative. The Russell 2000 had

Markets Retain Majority of Gains

Image
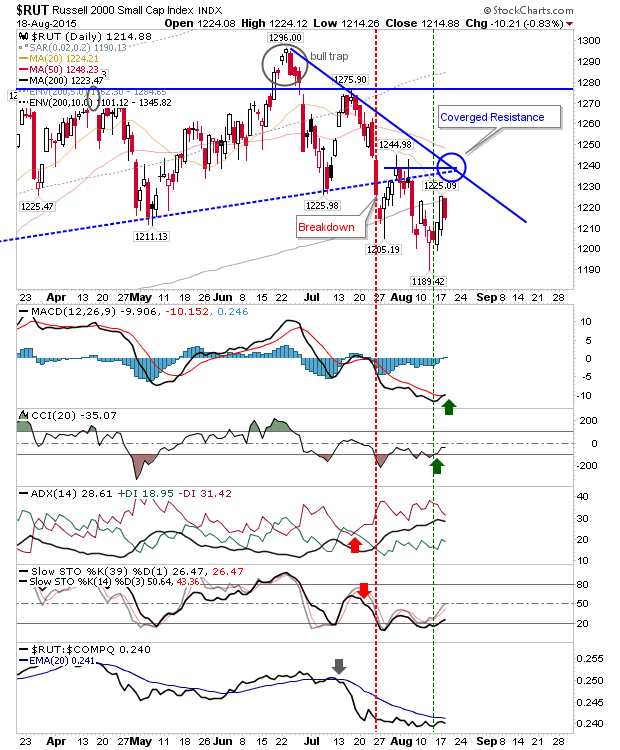
Not a day for big dramatics, but markets did well to hold on to Monday's gains. Selling volume was lighter than yesterday, so today wasn't seen as an opportunity to sell into strength.  The one index which was perhaps a little problematic for bulls was the Russell 2000. Here, the index lost nearly 1% as the 200-day MA stayed as resistance. This is he second time sellers have attacked this moving average. If bulls were to have a broader concern, then this index is the canary in the mine. Market leadership comes from Small Caps, and action in this index isn't great. Bulls may look to the weak MACD 'buy' as a sign of something better, but 1,189 will need to hold as support.

Preliminary Breakouts?

Image
The larger picture still holds to trading ranges, but the coiling action in the S&P suggests an upside breakout is in the making. It qualified on the basis of price, but volume was disappointing. Bulls will be happy, but tomorrow needs volume buying to suggest this breakout is genuine.

Markets Coiling

Image
Markets staged a recovery after bears were unsuccessful in pushing follow through selling after a break of intraday support in morning trading. However, markets are approaching a decision point where declining resistance on the daily converges with rising support. The S&P offers the classic coiling play. Add to this the presence of the 20-day and 50-day MAs within the coil, with the 200-day MA just below, suggests the next break could set the tone into September. Technicals are mixed with momentum at bullish support, but 'sell' triggers in the MACD, On-Balance-Volume and +DI/-DI.

Day of Rest

Image
After all the ups and downs, today was relatively calm. The picture from yesterday is more or less unchanged. The S&P is holding on to its 200-day MA, but given neutral action today and the proximity of the index to this moving average, it was a little disappointing. An undercut and weak finish Friday would set a more bearish tone for next week.

Spike Lows, But Are They Enough?

Image
Was today's reversal another short covering rally or the basis for a swing trade low. It was a frustrating day for myself as having effectively nailed the Dow low with an entry at 17,140 (which was a support level on the hourly time frame), I jumped ship just before the rally kicked off. C'est la vie. Volume climbed to suggest a possible capitulation. The problem remains the trading ranges which offer whipsaw risk all around (and keep me flighty in the market). Of the indices, the S&P was again strong enough to finish above its 200-day MA, but the long standing trading range of 2,044 and 2,130 has contained all of these recent swings. If there is some follow through upside, then watch watch happens when it gets close to resistance at 2,110.

Yesterday's Gains Reversed, But Not Total

Image
Not wholly unexpected, but after yesterday's short covering rally (which stopped me out, grrr...), today brought a return of sellers. However, sellers didn't have it all their own way. Because of this, there may be enough for bulls to build a rally, assuming pre-market doesn't ruin things! The Dow has struggled in recent days, but with a spike low of 17,279 to defend there is a chance for a bounce to make a test of the 50-day MA. Technicals are firmly net negative, which is no surprise, but also oversold.  On the flip side, if there is weakness in pre-market then 17,279 could be scuppered quickly. Today's selling marked as distribution.

Recovery In Indices

Image
It was a good day for indices, with the S&P rallying off its 200-day MA, and the Semiconductor Index breaking upside from its wedge. The Semiconductor Index closed with a 'Death Cross' between 50-day and 200-day MAs, while the breakout generated some bullish technical signals. The risk:reward remains good, even for a push just to the 50-day MA, and pullbacks will help lower this risk.

Late Recovery - But Is It Enough?

Image
After Thursday's selling there was some follow through in the morning, but buyers stepped up to the plate to retake most of the losses by the close of business. Not all indices are in the same degree of trouble, and for some, range bound trading remains. The Nasdaq closed above a former support level of 5,038, but with range support down at 4,900 what's happening now is mostly noise. The Nasdaq is still a distance away from a 200-day MA test, and while certain indices are testing (or have lost) such support, Tech indices have left bulls with plenty of room for maneuver.

Distribution Seling

Image
Yesterday's spike reversals came back to haunt the indices as markets followed yesterday's late selling with even more selling; selling which registered as distribution for some indices. While the Dow is under the most pressure, the greatest disappointment was the Russell 2000. The selling resulted in an undercut of the 200-day MA, a break which followed soon after a recent successful test - a sign this test may not hold. Next key support is 1,210, and from there one is looking at tests of 1,100 and 1,040.

Selling Spikes After Bounce Fails

Image
I should start by saying I have a short bias. It's not a clear cut play given the dominance of trading ranges since the start of the year, but sellers may be looking to turn the screw. Holiday volumes will keep things scrappy into September, but markets may get a kicker before then. The most vulnerable of the indices is the Dow. It's knocking below 17,625 support after falling below its 200-day MA for a second time in July. Bears will hold control as long as the index is below 17,800 (and 200-day MA). Technicals are weak, and nearly oversold, but three of the last four trading days have registered as distribution.

Archive

Show more