Posts

Showing posts from October, 2015

Small Caps Experience Selling

Image
There wasn't a whole lot of action in markets after yesterday's decent gains. The only index to suffer any kind of reversal was the Russell 2000. It holds on to its channel breakout, but the 1% loss will have hurt it.

A Late Flurry Rewards Bulls

Image
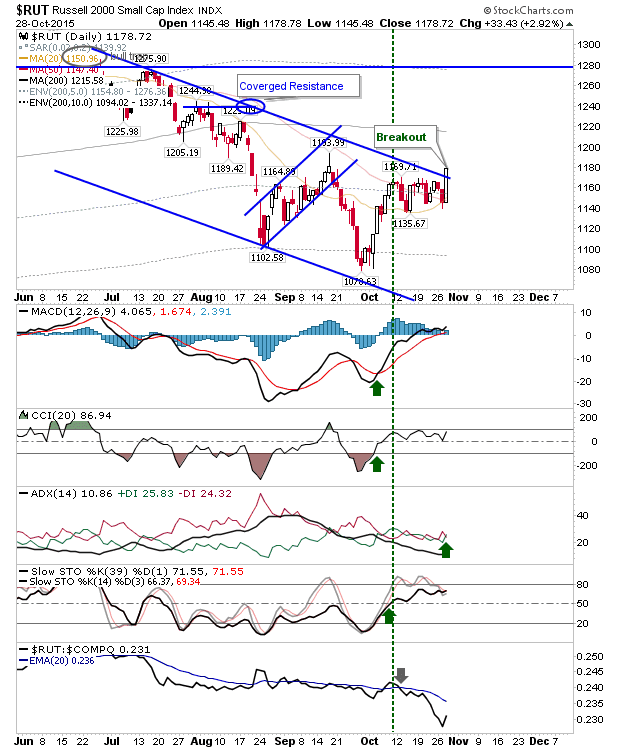
Trader's interpretation of a Fed interest rate hike first sent buyers running, then shorts were left scrambling as bulls took control. The Russell 2000 had the best of the action after a long period of under performance. It gained almost 3% with a channel breakout. It's looking good for a push to the 200-day MA.

Narrow Losses Keep Bulls Content

Image
The last couple of days have seen tight action which has helped consolidate gains. The biggest change has come with some of the relative moves in the indices. The S&P has added to its relative out performance, particularly against Small Caps. It's perhaps the only point of weakness given the importance of Small Cap leadership in sustaining bull trends.

Tech Gains But Small Caps Lag

Image
Friday was a good day for both Tech and Large Cap indices, with decent gains on modest volume. Small Caps also posted gains, but were unable to break the October consolidation or the declining channel. The relative performance of Russell 2000 has dropped off a cliff through October, which is a concern. A lack of leadership from speculative small caps will quickly kill the sustainability of this rally in Large Caps and Tech indices. If the Russell 2000 is to offer any form of leadership then it has to post gains on Monday as it's right against consolidation resistance. A push to 1,180 should be enough to break the declining channel. Of supporting technicals, only the +DI/-DI has yet to turn positive.

Sellers Try Again

Image
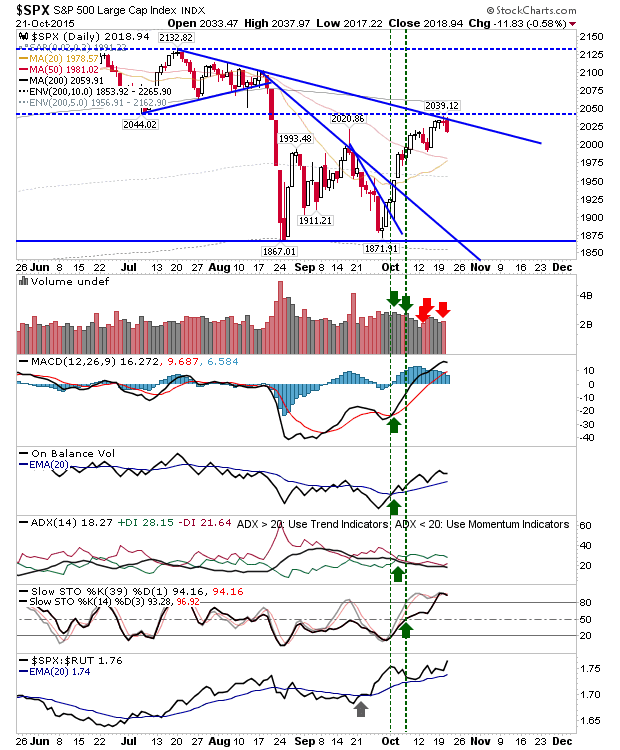
Today's selling looked much worse on an intraday chart than it probably created in reality. The profit taking did rank as distribution; distribution which kicked in at resistance for the likes of the S&P, but didn't do enough damage to threaten the breakouts in the Tech indices. While there may be some follow through down in the coming days, be ready for bulls to bid prices back. Remember, we are entering a seasonally bullish period. The S&P has offered the picture perfect short play for those who took advantage of the tag of resistance. Technicals were little changed after today and hold with a bullish outlook.

Minor Losses

Image
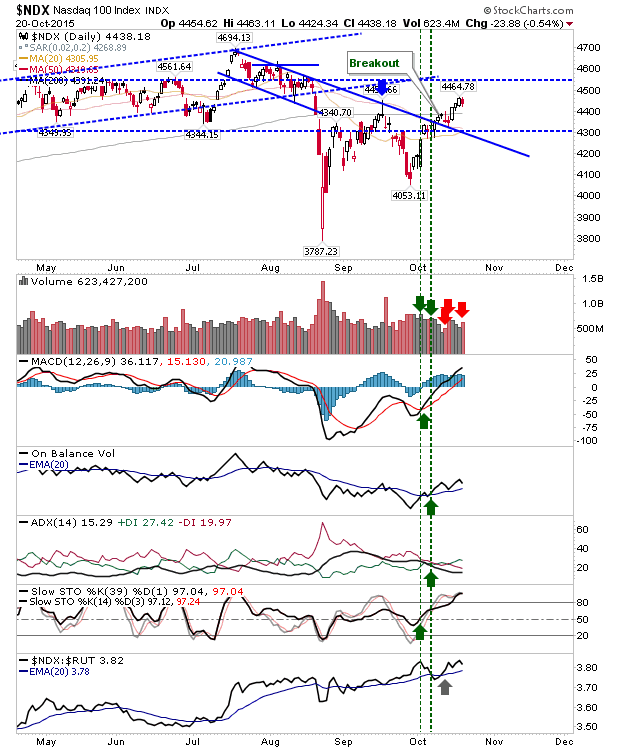
Small gains yesterday, small losses today. The tone of the action hasn't changed and markets wait the next big move. Volume climbed to register as distribution, which is perhaps the only point of interest today. The Nasdaq 100 remains above its 200-day MA but below the jobs-data spike high. Of the indices, it is caught between supply and demand, but technicals are firmly in bulls favour. If bears are going to get joy, then a push below 4,300 will be needed.

More Gains Squeezed From Markets

Image
There wasn't much to say about today. Small gains kept things ticking over, but there were no key breaks of resistance.  Tomorrow is another day. Shorts may again try to short the S&P with today's close near highs, and the convergence of resistance.

Friday Posts Gains

Image
Bulls continued to squeeze shorts. This time I was thankful not to attack it as a short, but there didn't appear to be a lack of others on the wrong side of the trade. Volume wasn't great, but long holders won't mind that. The S&P is approaching a crux of resistance between the swing low of July and declining resistance from July/August highs. Above that lies the 200-day MA, which may offer a spike high. Bears would ideally like to see a failed move above 2,044, with a close at or below 2,044. Technicals are all in the green, which gives bulls reason for optimism.

Semiconductors Have Best of Day's Action

Image
Lead indices continued to experience selling, but Semiconductors posted strong gains which may help drive the Tech indices over the following days (despite minimal positive impact today). The index has already pushed the breakout, and today's looks like a follow through on this breakout, not to mention a break beyond the September swing high.

Sellers Return

Image
It has been a while since sellers finished the day with the upper hand.  But since the retest of August lows sellers have found it difficult to build a foothold for which shorts can attack. Today's action is a start, but it's not a victory for shorts. The Nasdaq 100 has been knocking on the door of the 200-day MA for a few days, but today was the day it finished with a bearish gravestone doji at this moving average. The 'Breakout' is still valid, and technicals are still net bullish, but a 'bull trap' would increase pressure on longs.

The Cherry on the Cake?

Image
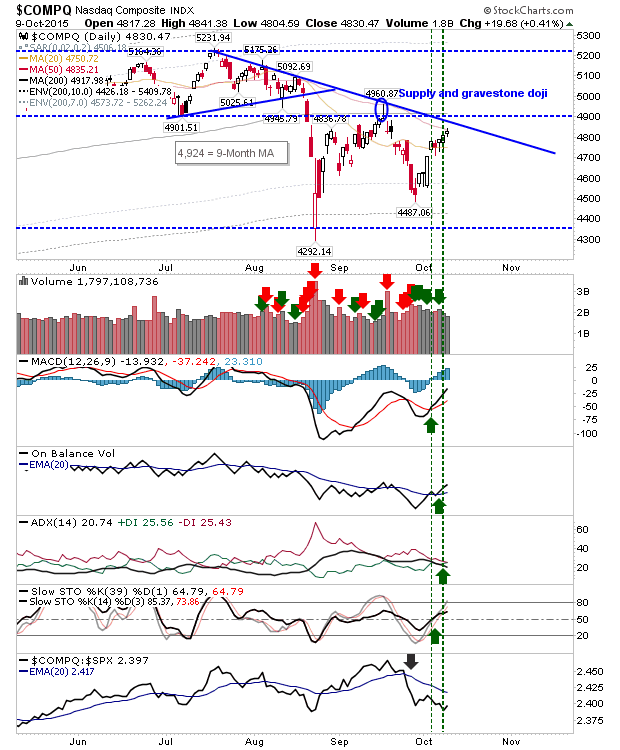
After the rally of the last couple of weeks, Friday's narrow range gains felt like it may offer bulls a break from their buying. There are a couple of resistance levels in play for some of the indices, but these have't played important roles in recent months as markets traded in narrow ranges. The Nasdaq is one such index. It finished Friday at its 50-day MA with a supply level lurking at 4,900 and declining resistance between it and 50-day MA.

Bulls Keep Buying Into The Close

Image
Good stuff for bulls as resistance levels get ticked off on the advance. There breathing room for many indices and a chance for consolidation. Nit pickers could point to light volume, but it would be hard for buyers to be coming in here given the sequence of gains. The Nasdaq 100 still remains tagged to resistance. Can it break tomorrow or will sellers make an appearance. All I know is yet another short trade of mine is stopped out. I should add, I haven't touched my investment account. I would be looking to buy if I had the funds available.

Yesterday's Losses Reversed

Image
Bulls can be happy with today's progress. What weakness emerged today was reversed by the close, a change on yesterday's action where sellers dumped in the last few minutes of trading. Volume climbed to register an accumulation day. The S&P finished at the 50-day MA, but beyond that there is plenty of room beyond that to run to the next level of resistance at 2,045. Technicals are net bullish.

Markets Hold Bulk of Gains

Image
Most of the gains were posted pre-market, but bulls were able to hold gains after a couple of days of bullish strength. The S&P is on course to finish with a spinning top doji. The 50-day MA is just overhead and close to 2,000 psychological resistance. Technicals are close to turning net bullish.

Markets Post Gains - Breakout in Dow and Semiconductor Index

Image
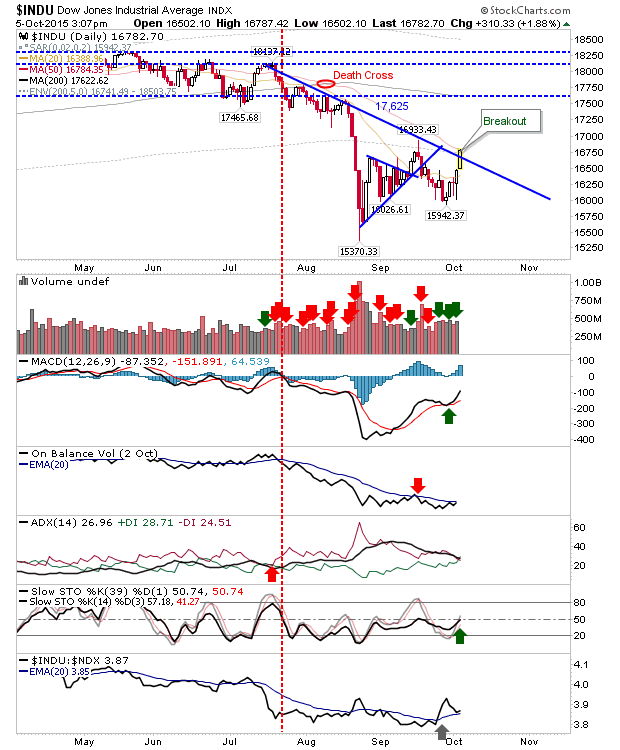
A fresh day of gains keeps bullish momentum running in healthy action. The Dow was the first index to break past declining resistance established by July - August declining trendline. Volume also climbed to register accumulation.

Minor Gains

Image
Things were looking a lot brighter in premarket, but in the end bulls were able to push markets into a higher close, even if volume was lighter than yesterday. The S&P nicks a breakout of declining resistance from the September high, but hasn't yet challenged declining resistance connecting August and September levels. Technicals hold on to their bearish outlook. Based on the table listed at the end of this article, the S&P would need to drop to 1,600 to register a 25% loss from highs.

Archive

Show more