Posts

Showing posts from March, 2023

Indecisive gains, if there is such a thing...

Image
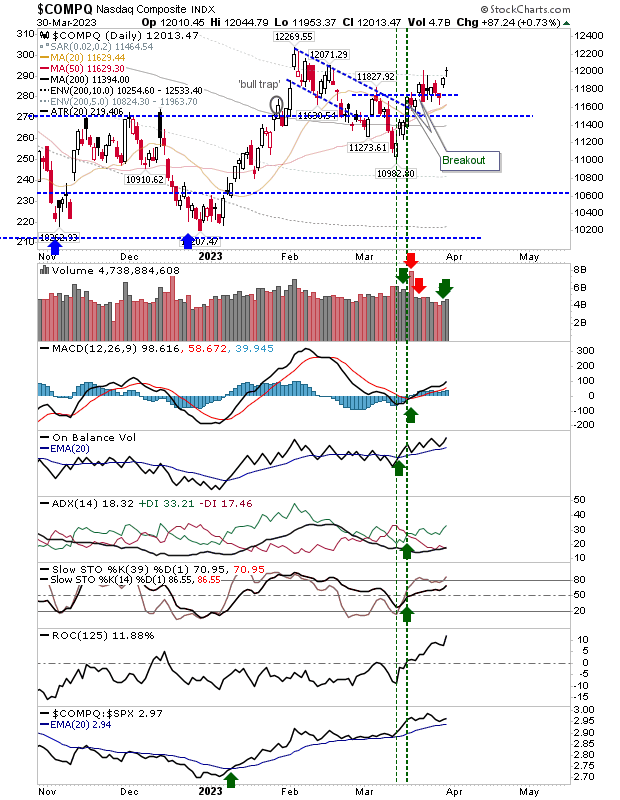
Buyers were able to drive gaps higher at the open, but couldn't build on the initial gains. The Nasdaq managed to make a new swing high for the March rally, but it could take a while before the February highs are challenged.  Technicals are net bullish, and more importantly, the index is outperforming the S&P.  It looks like risk can be measured against the 50-day MA.

Russell 2000 needs to bust out of its range

Image
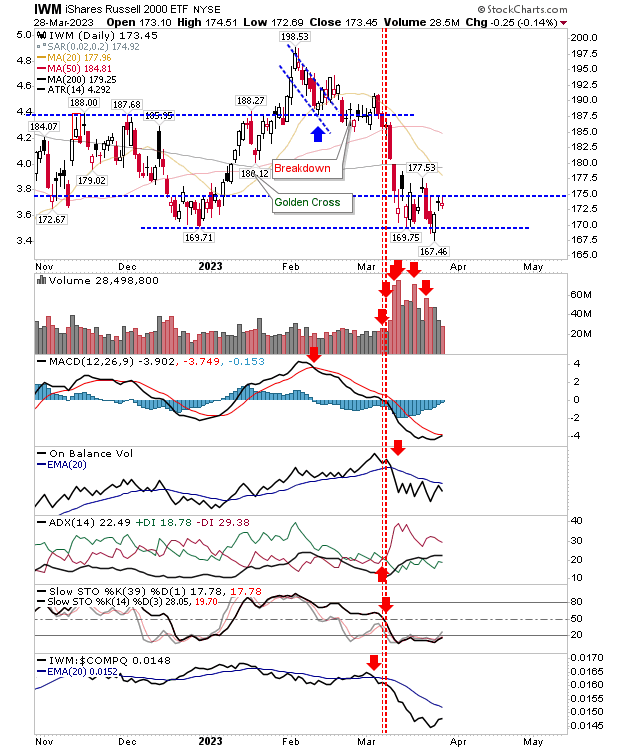
It's getting a little dangerous for the growth stock index.  The Russell 2000 ($IWM) is experiencing an ever decreasing series of individual highs as it looks to defend December lows.  Technicals are net bearish, but there is a chance for a 'weak' buy below the bullish zero line.  Trading volume is a little light, but really, I want to see a solid white candlestick rather than the two indecisive candlesticks over the last couple of days, particularly as Friday's 'bullish' piercing pattern had promised more.  The March consolidation is not the best if you are of bullih persuasion. 

Wednesday's selling was tough, but Friday offers hope

Image
"Hope" is a bad word in trading, but markets are holding up better than I expected.  The Russell 2000 is the index to watch because of the import of growth stocks to secular bull markets, but also because it's the index closest to crashing.  Friday was an important day for the Russell 2000, as the index started with a gap down.  There was significant risk of a collapse, but buyers stepped in and managed to deliver a close above support.  This is key, because Small Caps closed above support as defined by candlestick real bodies. Buying volume was a little light, so no accumulation, but I would be okay if at some point in the coming week we did see some accumulation.  Technicals are net negative, and while Friday's price gain was good, there was no improvement in supporting technicals. 

Markets giveth, then taketh away

Image
Monday's action had looked to provide some security for bulls, but then bears came in with gusto and closed the day with bearish engulfing patterns for the Nasdaq and S&P, and a big red candlestick for the Russell 2000.  The Russell 2000 experienced the biggest sell off of lead indices. The substantial red candlestick came with higher volume distribution, at a time when it looked like the selling was done.  The index continued with its underperformance to the Nasdaq and S&P, so it looks like crash watch is back on.

S&P breakout adds to the earlier breakout in Nasdaq

Image
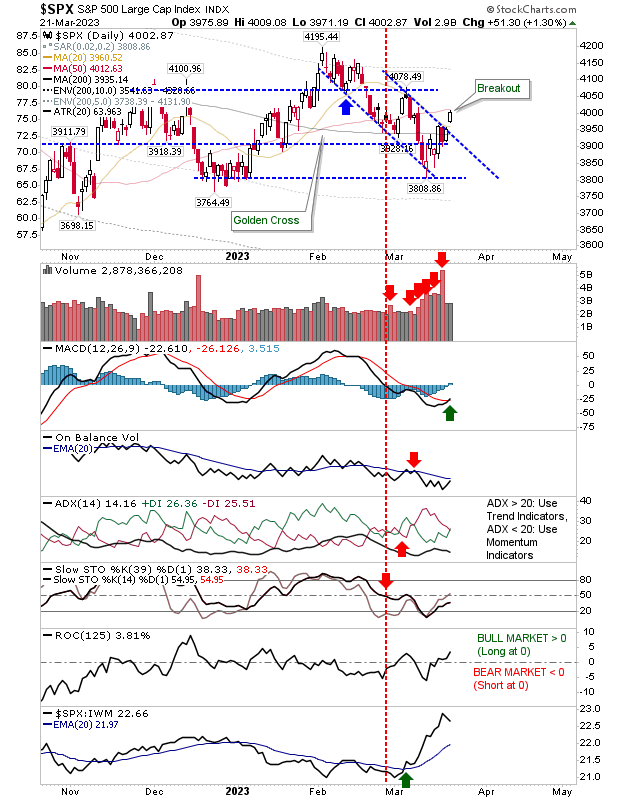
Friday was a sticky finish for markets, Monday managed to make back some of this lost ground, and today delivered a breakout in the S&P. I had talked over the weekend about the risk of a crash, particularly in the Russell 2000, but today's action in the S&P goes some way to averting this scenario.  The Russell 2000 is still in trouble, but there is reason for optimism in the S&P.  The gap move above resistance came with a new 'buy' trigger in the MACD, although other technicals remain bearish.

Friday's selling threatens major support in Russell 2000 (and maybe S&P too...)

Image
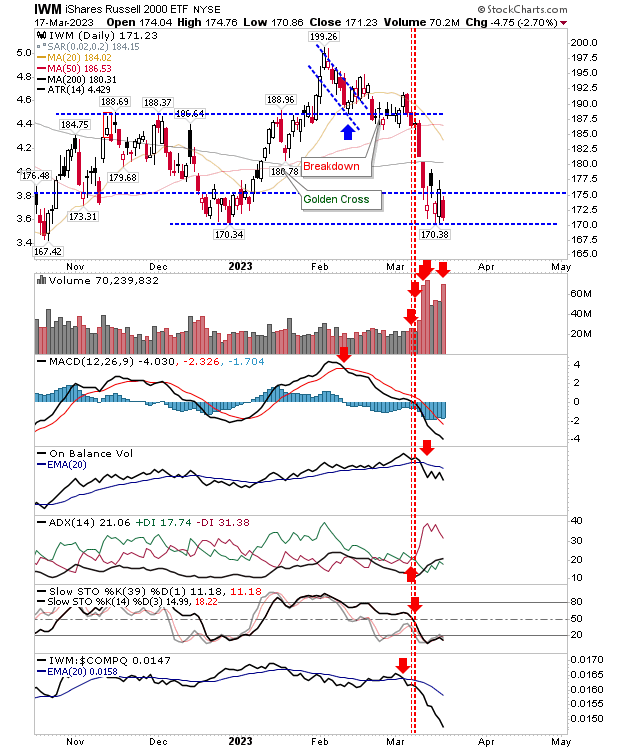
Tricky times for markets, but for the Russell 2000 in particular. Since the start of the Silicon Valley Bank crisis we have seen a rapid deterioration in the state of the markets, and the vulnerability for a crash, as crashes occur not from highs, but when markets are oversold - and that's where we are now. However, last summer's low is a low of consequence and import, so I would see any additional loss as a temporary loss that should quickly reverse and offer excellent buying opportunities for those willing to take the risk (as a long term investor).  Where it gets more questionable, is how far any such sell off/crash could go.  But before we get there, we need to see a loss of existing support.  For the Russell 2000 ($IWM), this is the $170 level. Selling volume surged last week in confirmed distribution and technicals are net bearish. Relative performance is also accelerating lower. 

Nasdaq manages to stage a breakout

Image
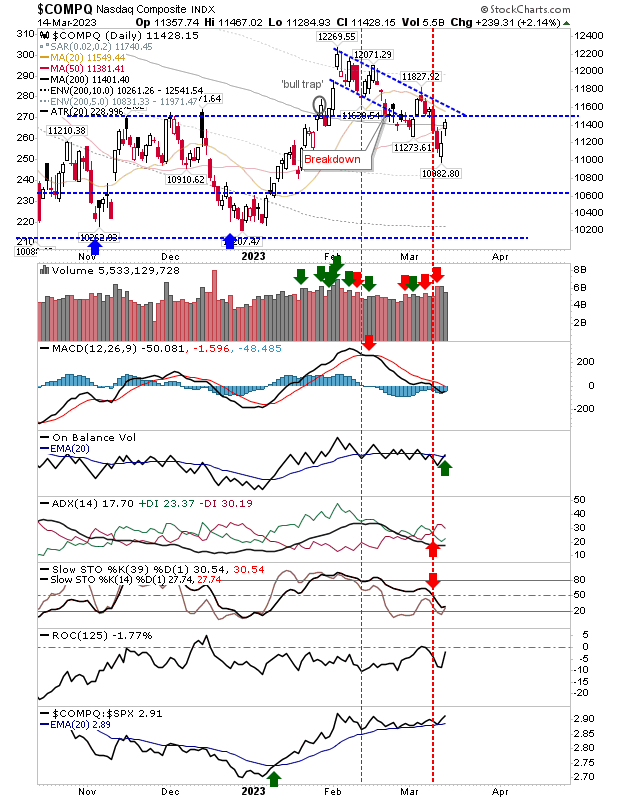
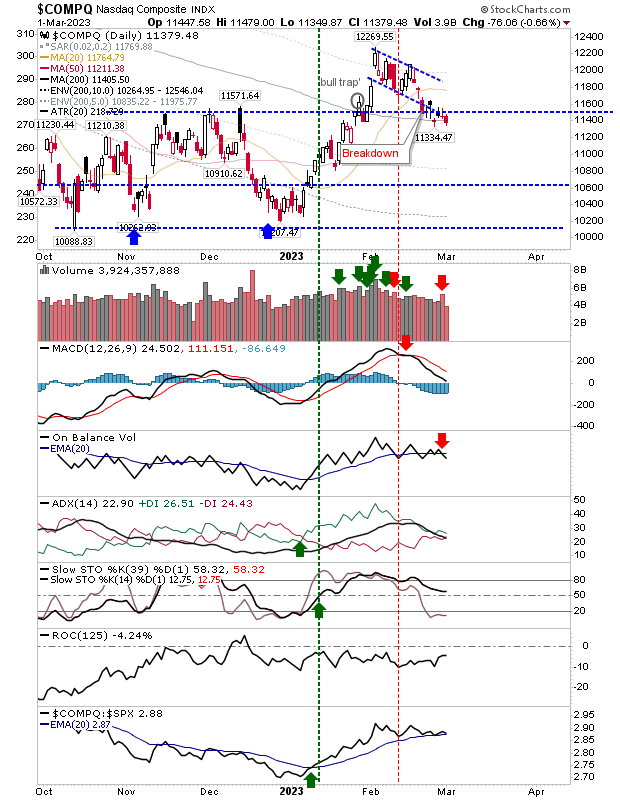
After a volatile few days, indices have managed to stage a recovery with some indices doing better than others. The Nasdaq managed to return above support, while breaking resistance from what had been a 'bull flag'.  Volume eased back despite the gain; not a great association given the extent of today's move higher. Play the resistance breakout, but we don't want to see an undercut of 11,500 support. 

Fear in the air

Image
Given the severity of the SVB inspired sell-off in the indices, I have a high degree of skepticism as to the validity of the recovery bounce over the last two days.  Buying volume is down, and has so far failed to challenge the distribution which has come before. We have had confirmed breaks of support, and those support breaks remain valid as of today. The Nasdaq lost 11,500 breakout support but has at least managed to recover its 200-day MA. Again, I would rather see breakout support regained (now resistance), but there is a chance another days buying will deliver on this.  There is a fresh 'buy' trigger in On-Balance-Volume.  The index isn't really at a trade position, a short looks more favored, but it would be a noisy trade. 

Banking panic cracks support in the indices

Image
A potential area for support and buyers was quickly undone by the panic generated by the collapse of the Silicon Valley Bank. While I tend to go with technicals over fundamentals, this looks to be a case where the fundamentals did override the technicals. Unfortunately, the tentative situation indices were in is now a different space. For the S&P, there was a fresh break of support with an undercut of the 200-day MA on confirmed distribution. Technicals are net bearish, although relative performance has moved sharply in the indices favor. 

Hold the horses - buyers are back.

Image
After two days of selling, markets stuck in a quick pause. It was a narrow range day, so not a whole lot to work with, but it was interesting to see where this buying occurred. For the Nasdaq, the buying was again at breakout support. Volume was well down on Friday's distribution, so I wouldn't be expecting any big bounce here, but it might be enough to keep losses from piling on. There was a new 'sell' trigger in On-Balance-Volume to add to the current 'sell' trigger in the MACD. However, stochastics remain on the bullish side of the fence.  For now, the 'bear trap' remains in play. 

Weekly Chart Review

Image
I haven't talked much about the weekly charts, although they are still part of my free stockcharts.com public list . When you are getting spun around by daily charts, it's always good to fall back on weekly charts to see the big picture.  If you are an investor, then the weekly charts are all you need. I have been waiting for a confirmation of the breakout on dailies, but these just keep flipping back-and-forth on that timeframe.  On the weekly chart, there is a well established break of the bearish trend, but this hasn't yet shaped the move to build the right-hand-side of a new base.  In the case of the S&P, the summer high is the more important resistance level (currently at 4,325).  Technicals are moving out of bearish territory, in particular, the MACD is working its way above the bullish mid-line.  On-Balance-Volume is also about to turn bullish (on the weekly time frame).  The caveat, as a weekly chart, it could be the end-of-the year before we even see a chal
Strong finish to week for the S&P and Nasdaq

Image
Friday picked up on Thursday's gains to push back on the support break. There hasn't yet been a challenge on earlier 'bull flags' resistance, but we will likely see how much resistance there is at these levels early next week.  In the case of the Nasdaq, there was a successful test of the 200-day MA, that came with a new On-Balance-Volume 'buy' trigger. However, there is no pending MACD trigger 'buy', so it's going to take a few more days of positivity to drive this.  The index is clinging on to its outperformance against the S&P. 

Sellers are preventing a support bounce in lead indices

Image
Since indices returned to breakout support after the early year surge I had thought we could have seen some form of bounce, but the longer markets linger at these levels, the less likely we will see a bounce.  Today's candlesticks across indices definitely leaned more on the bearish side, and if I had expectations, it would be for further losses tomorrow.  While today's action ranked as firmly bearish with a distribution day yesterday, it's still managing to hold its 200-day MA. The index is outperforming peer indices, but it is losing ground to the S&P. 

Archive

Show more