Posts

Showing posts from September, 2022

Yesterday's relief bounce negated in one day

Image
It was always going to be a tough sell given the speed at which markets pushed down into a retest of June lows last week, but I would have thought a bounce would have lasted longer than a day.  The Nasdaq hasn't violated the June low yet but with Friday's end-of-week print likely to see additional pressure into the overweekend-hold price, it's not looking great for tomorrow.

No bounce, markets set for more losses

Image
After Friday's close I would have expected some form of bounce - either today or yesterday - but this didn't happen. On the (somewhat) plus side, there was no undercut of support of June lows for our monitored indices, although the Dow Jones Industrial Average did undercut such support last Friday and it didn't get much better day with another standard bearish candlestick today.

Look for a bounce Monday, but don't expect it to last

Image
Friday's finish resulted in a nasty weekly candlestick, but a more bullish 'hammer' daily candlestick across the three lead indices I follow.  Given that, I would look for some reaction from bulls, but by the end of week it could be bears again calling the shots.  Markets are in a retest of the June swing low, but breadth metrics are not as oversold - the Nasdaq Summation Index in particular. 

Bulls fail for a second time - but outcome is more damaging

Image
There was no doubt as to where control lies in the market after today's finish.  The second reversal opportunity which was playing at the 61.8% retracement of the June-August rally has failed, and with today's volume, ranked as confirmed distribution. It was the same for the Nasdaq, S&P and Russell 2000.  We will start with the Russell 2000. It had the most support to work off, but it has cleanly cut through the Fib retracement zone. It still has the relative performance advantage over the Nasdaq and S&P, but today's candlestick suggests there will be further losses tomorrow.  There is some support around $170, which is the next target before the June low comes into range.

Bullish Engulfing Patterns - But Volume Light

Image
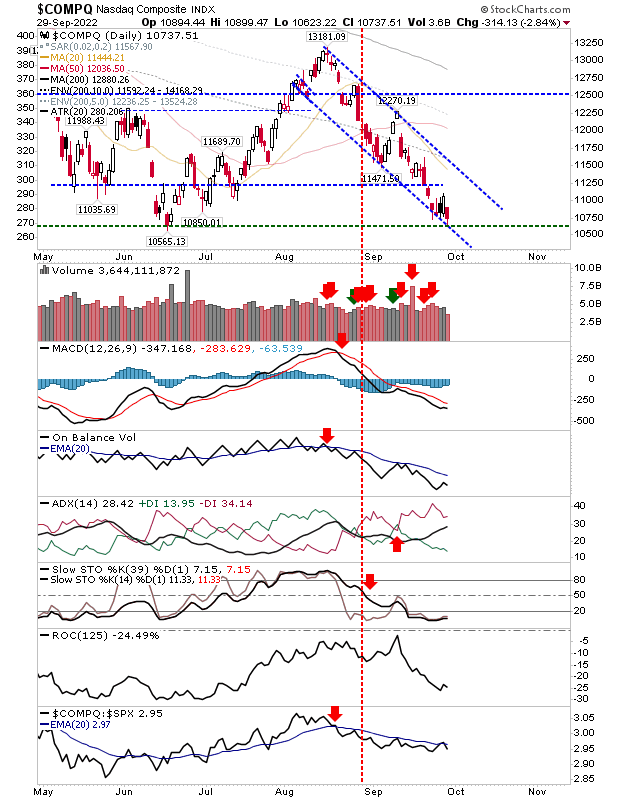
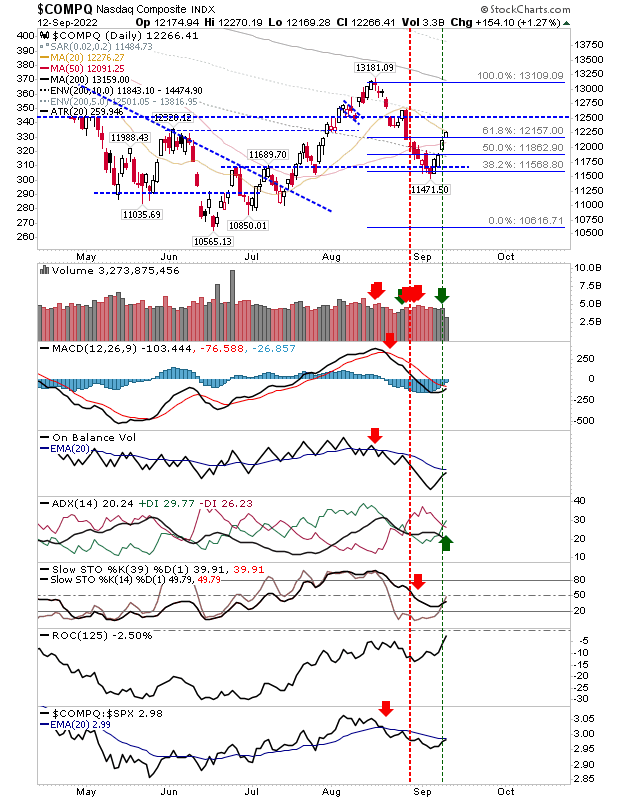
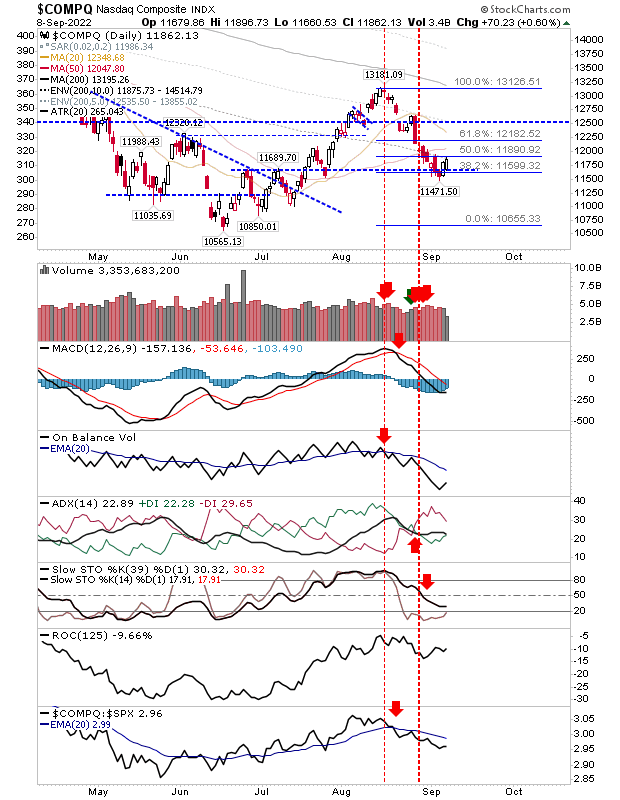
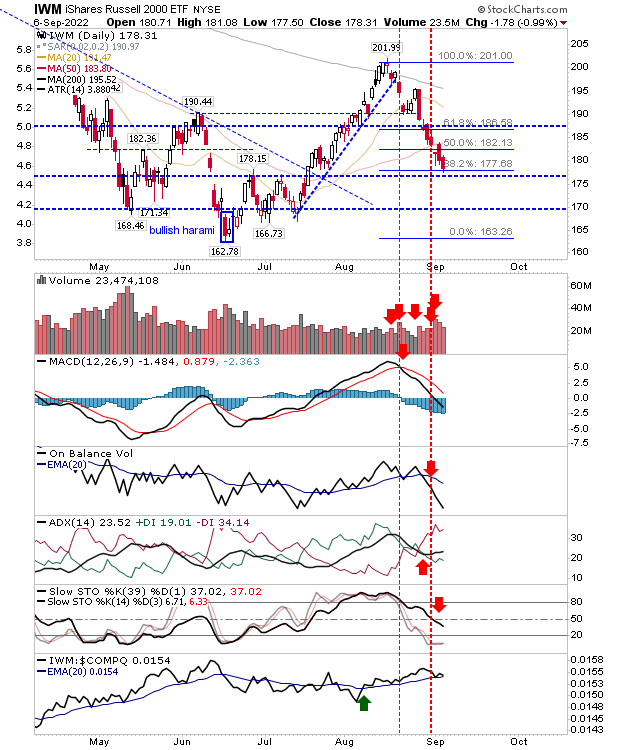
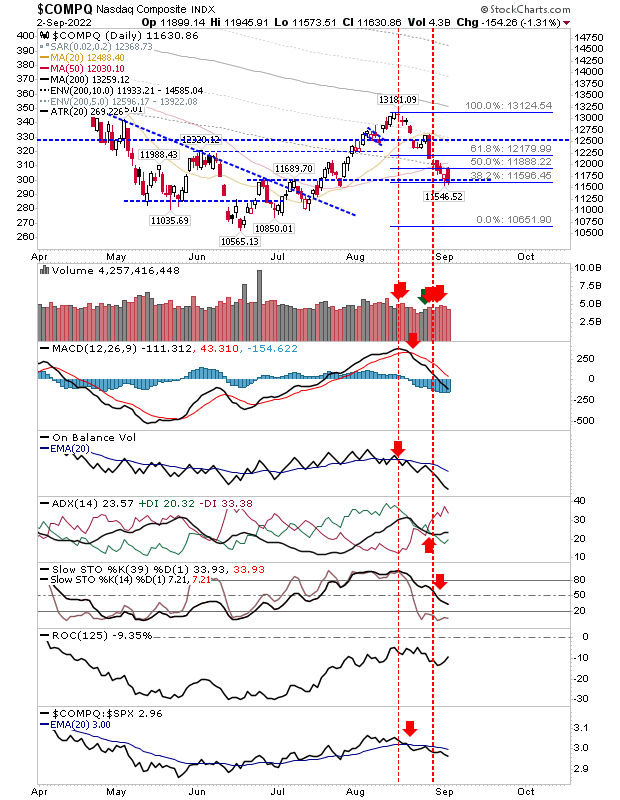
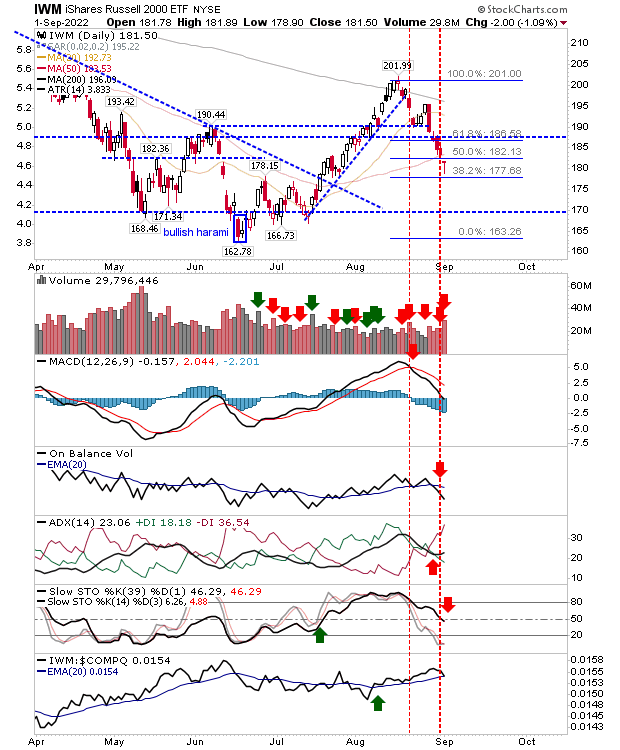
If today's buying volume was greater it would have been considered a good day; instead, it's a day with potential but still needs more from buyers to convince.  On the positive side, bullish engulfing patterns like today's are reliable reversal patterns, and traders could use them as buying opportunities with a stop below the low of the pattern (exit on a close below rather than an intraday violation). How much upside to look for will be contingent on the amount of buying volume we see over the coming days, but closing the gap down in early September following the 4-day sequence of gains would be a good start as an initial target. In the case of the Nasdaq, we didn't see a whole lot of technical improvement, neither was there much in the way of relative performance gains to peer indices. So, at the moment it's a pure price play trading just above support.

Bulls last chance to bounce the decline

Image
Markets are running out of opportunities to stall the decline from August's swing highs.  Friday's options expiration will have clouded the volume picture, so we don't necessarily have a clear capitulation but there could be some cause for optimism. Indices have gone beyond the standard Fibonacci retracement and there isn't a whole lot of room for bulls to come in without a full retracement of the rally to become the most likely outcome to emerge here. The Nasdaq closed with a gap down bullish 'hammer', which leaves it open for a gap higher and potential bullish morning star set up; but for that to happen we have to start with a opening gap higher and there can't be a close below Friday's open (and ideally, no intraday violation of Friday's low).  Technicals are oversold, which does favor some form of bounce - but such a bounce is not necessarily one to start a new long term rally - as a trader, we can only use the information we have.  If looking to

Sellers wipe four days of gains in one go on higher volume distribution

Image
Forget about today's non-action, the damage was done yesterday on a significant escalation in volume. Today was just a pause in that selling. Optimists might see today as a bullish harami, but in the absence of an oversold condition (momentum technicals) I would discount this.  Expectations are for a move back to June lows - and possibly new lows - but should this happen then we would likely see a significant bullish divergence in breadth metrics.  It would yet be another major buying opportunity for investors, but let's see what the next few days bring.  The Nasdaq is back at the 62% retracement (38.2% on the chart) for a second time.  I wouldn't expect this second test to be successful, but for now - that is what it's doing. Today's buying volume was well down on yesterday's selling and technicals remain firmly bearish.

Four straight days of gains on falling volume

Image
This bounce has gone through 50-day MAs and is now challenging 20-day MAs for the S&P, Nasdaq and Russell 2000.  Since the swing low was established last week indices have rallied without pause.  At this stage, we would want to see how markets react to when sellers return.  For the early part of the day it looked like we were going to get that mini-top reversal candlestick, but instead, all indices were able to close at highs.  Gains in the Nasdaq were enough to see a 'buy' trigger in the ADX, although there is still need for a few more days of gains before technicals turn net positive - something we may not see.  The index is also underperforming relative to the S&P, but is close to a signal crossover in this regard (towards outperformance). 

Fibonacci bounce chalks up a third day on close above 50-day MAs

Image
Bulls will be happy the bounce managed to add another day, but the buying volume remained disappointing. However, we did see easy breaks of 50-day MAs, which opens up moves to 200-day MAs and/or August highs.  Whether we ge there will largely be determined by buyers stepping in with volume, but we can let price action drive momentum for now. The S&P added to the bullish momentum with a new 'buy' trigger in the ADX, but other technicals remain bearish.  The index is just above holding on to its relative performance advantage against the Russell 2000 - but is on the verge of an underperformance switch to this index.  The other indicator to watch (which I don't mention much) is the Rate-of-Change (ROC).  If ROC can return above '0' it would mark a cyclical return for bulls. 

Fibonacci support bounces lack volume

Image
The last couple of days are a bit of a mixed bag.  We got the last-chance-saloon bounce that markets needed if not the enitre move from June lows was to retrace, but the volume for some of the indices wasn't exactly crying out in buyer demand.  Starting with the Nasdaq, there really was very little buying volume today as the index gained less than 1%. We have a 50-day MA overhead which didn't offer a whole lot of support when it was tested last week, but it may be more troublesome as resistance.

Russell 2000 suffers heaviest loss as selling continues

Image
Friday's selling continued into Tuesday, with the Russell 2000 experiencing the worst of the losses.  Indices are fast running out of support with Fibonacci retracements under threat after today's losses; this has become most apparent in the Nasdaq but no index is safe.  The Russell 2000 is looking the most vulnerable as today's bearish candlestick has the look of a continuation move. The selling in the Russell 2000 has only just delivered a loss of stochastic midline support which adds to the pressure on bulls and means we are looking at a return to the bear market phase which has dominated throughout 2022. 

Bulls fluff their lines into the Labor weekend

Image
It was a classic technical bull trade but somehow bulls contrived to make a mess of it. It's not all lost, but the gap higher which quickly reversed and weakened throughout the day doesn't leave much room for maneuver.  For the Nasdaq and S&P there were bearish engulfing patterns of Thursday's bullish hammers.   Thursday's doji in the Russell 2000 was similarly engulfed by Friday's selling.  The net result is to expect further losses when traders return to their desk on Tuesday.  Stochastics for the Nasdaq haven't yet reached an oversold level which is a little troublesome given the extent of losses leading into Friday's losses.  The opportunity for the momentum rally at the stochastic mid-line is now off the table - so now we have to look at the possibility for a bottom when stochastics do finally reach an oversold state. 

Silver lining? Bullish hammers at Fib retracements for lead indices

Image
If there was a setup for a bullish reversal in the indices then today was the day.  The Russell 2000, Nasdaq and S&P all closed with bullish reversal candlesticks down at the 61.8% Fib retracement of the move from June through August.  However, any further loss would open the possibility for a complete retracement to the June low. The Russell 2000 finished the day with a doji on higher volume distribution.  Stochastics finished just below the mid-line, resulting in a net bearish technical picture - but these same stochastics are at a level where rallies in bull phases occur (the Russell 2000 having jumped to the bullish side of this equation in July).

Archive

Show more