Posts

Showing posts from March, 2014

Daily Market Commentary: Failed Bounce
Image
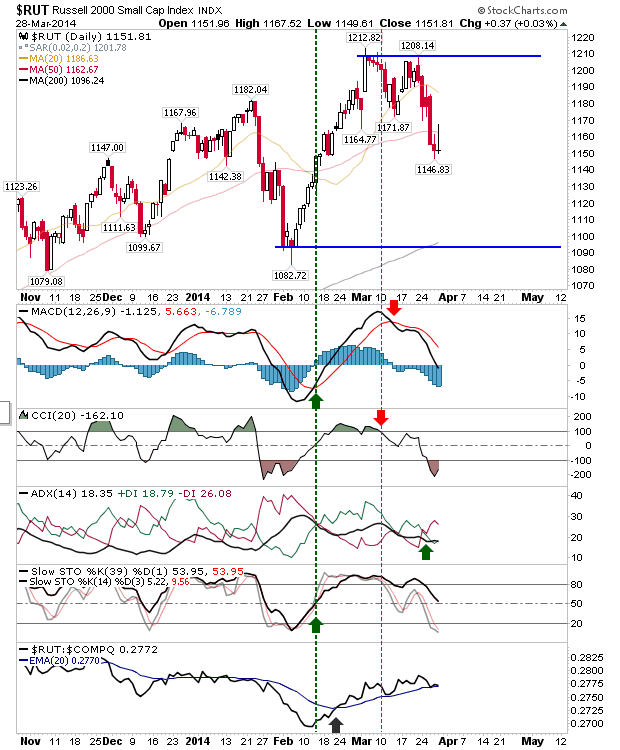
Interesting action in the markets. Five days of sharp selling in the Russell 2000 should have set up for a relief bounce, but bears were quick to sell the morning bounce bringing markets back to their open price by the close of business. Monday offers another opportunity for buyers, and while they didn't enjoy success on Friday, they may do better on a second attempt. Thursday's swing low of 1,146 looks a good place for stops.  Watch for sellers again at the 50-day MA.

Daily Market Commentary: Small Caps Rout

Image
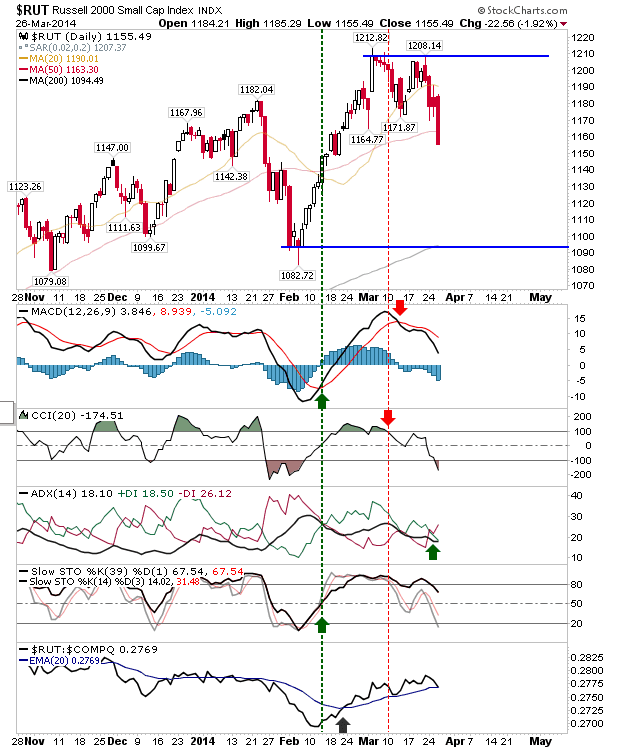
A day of hidden losses. The S&P rejected a fresh test of resistance, but didn't take significant losses by the close. Volume climbed to register distribution, but it was well below Friday's whopper volume. However, Small Caps took a big hit, dropping nearly 2% as buyers stayed away.  Losses were quick to undercut the 50-day MA and the March swing low. Next up is the February swing low and/or 200-day MA. Relief bounces are likely to be shorted at the 20-day MA.

Daily Market Commentary: Stalled Rally

Image
Buyers concentrated their attentions on the S&P, but the attempted rally stalled as it approached yesterday's high (which is below larger resistance).  Bulls may yet attempt another rally tomorrow, although after today's close the S&P is scored even between bulls and bears.  The MACD and On-Balance-Volume are near term bearish, but stochastics remain firmly in the bulls camp.

Daily Market Commentary: Day 2 to Sellers

Image
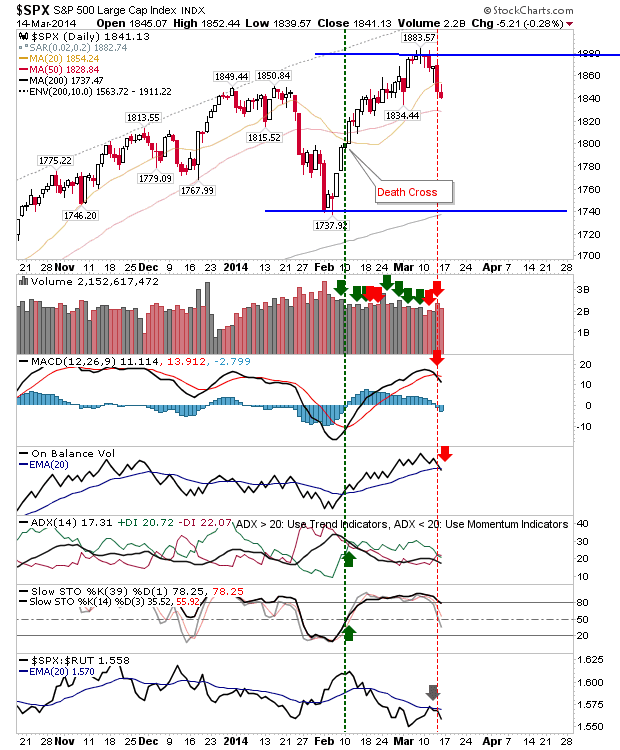
Bears were able to push markets into a second day of selling, but the last time they were able to chalk a third day of selling in a row was December. In bears favour is the lack of support; for example, the next support level for the S&P is the 50-day MA.

Weekly Market Commentary: Rejection of S&P Highs

Image
Friday was set up for bulls, but in the end they couldn't maintain the push. The S&P experienced the largest swing as it posted at a new high from the open, but rejected an attempted a follow through near midday. From there on it was down all the way. Volume climbed to register as significant distribution, although the bulk of the volume came on morning buying (which is now trapped from the latter selling).  This kind of reversal can get ugly quick. Not a time to buy, an aggressive short with a stop above 1,884.

Daily Market Commentary: Modest Bullish Action

Image
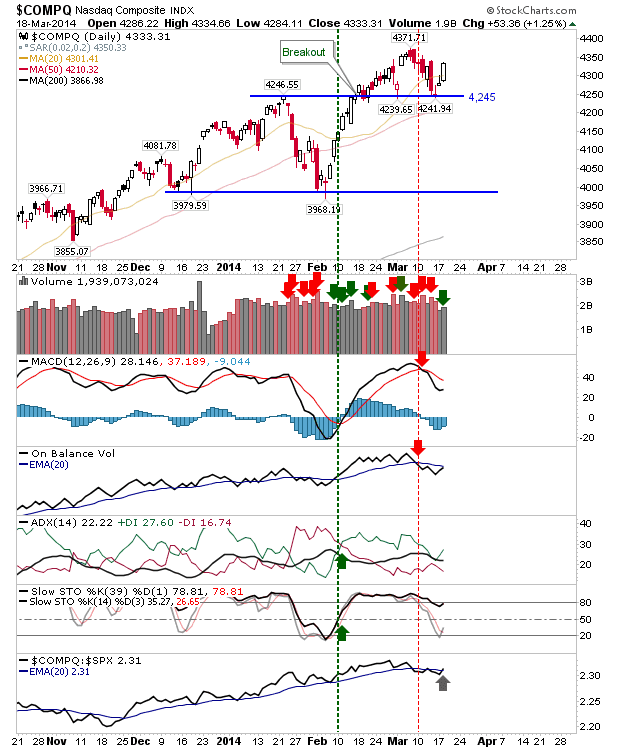
The back-and-forth between bulls and bears continued, this time with bulls controlling the day. Action tightened as the spread between the day's high/low narrowed, although the S&P still managed to experience a relatively wide trade day. Action in the Nasdaq is narrowing to a coil. It could spring either side: a short break should bring a test of 4,245; an upside break will bring 4,371 into play. Either way, a stop can be placed on a flip-side and play it from there.

Daily Market Commentary: Selling Distribution

Image
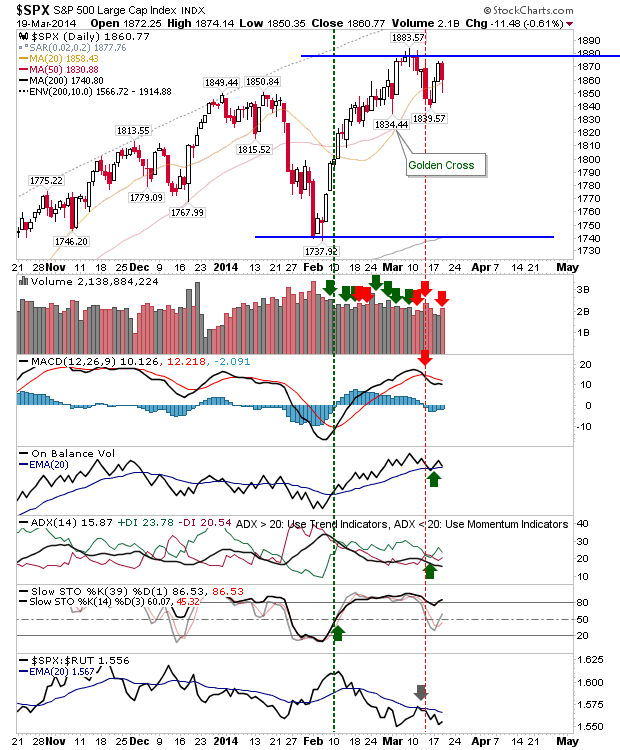
Wide range days made appearances across the board. Volume climbed to register distribution, but the day was not significantly bearish to suggest either bulls or bears have control. Tomorrow could result in an inside day as it would be hard to see three wide days follow with a fourth within a broader area of congestion. The S&P finished at its 20-day MA without managing a challenge on resistance.

Daily Market Commentary: Low Volume Gains

Image
While it didn't bank the biggest percentage gain, the Nasdaq was able to register a day of higher accumulation, although volume was light in general.  The gain in the Nasdaq didn't change the technical picture a great deal, but it did manage a close above its 20-day MA.

Daily Market Commentary: Gap Rally Fades at Close

Image
Bulls made a stab at forming a swing low with a gap open, but were unable to push on with further gains. Sellers returned in the afternoon, but the gap remained in play by the close of play. The Nasdaq remains the index best positioned to build on bullish momentum given it still holds breakout support. I have redrawn the line in the sand for this index at 4,245; a failure of which would see this morph into a broader trading range with support down at the December and February swing lows.

Daily Market Commentary: S&P Breakout Lost & Happy Paddy's Day

Image
The S&P breakout (from the January highs) was negated on Friday's close, effectively converting the February-March rally into the boundary for a horizontal trading range. There was a 'sell' trigger in On-Balance-Volume to follow the earlier one for the MACD.

Daily Market Commentary: Bears carry a sting in their tail

Image
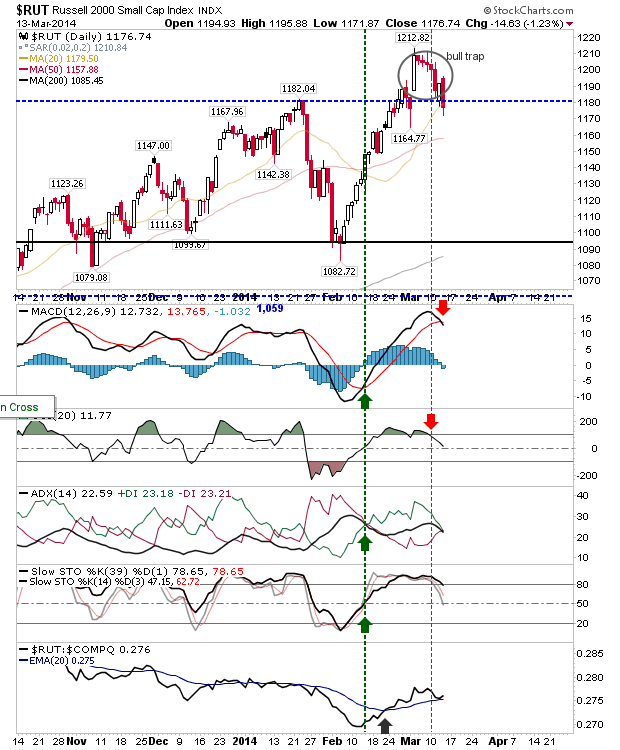
Old news was tied to today's losses, but this is a rich market which if offering more to holders who have held shares over the last 5 years to sell, than those willing to buy.More importantly, it was the first real day of intent from sellers, as up to now, bearish action had been weak. Volume registered as confirmed distribution. Hardest hit was the more speculative Russell 2000. The sizable bearish engulfing pattern effectively wiped out the breakout, leaving a bull trap. The index did finish on its 20-day MA, but I wouldn't get too comfortable with that. There was a 'sell' trigger in the MACD to add to the misery. Even with this, the index is still outperforming the Nasdaq.  Shorting opportunities will become available on rallies back to the engulfing high.

Daily Market Commentary: Bulls Take The Advantage

Image
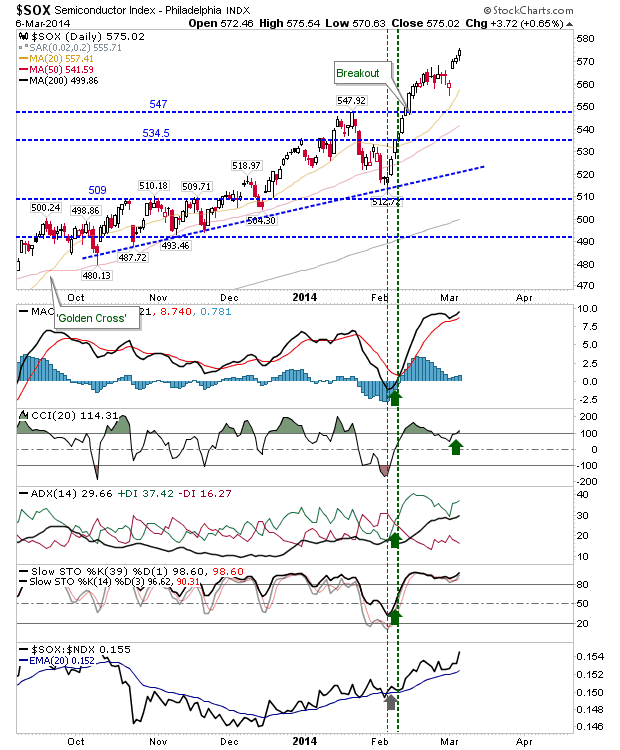
Better stuff from bulls as traders mounted defenses of support. The semiconductor had the best of the action, its large bullish engulfing pattern off the 20-day MA keeps with the story of an accelerating trend. It's not totally out of the woods: the MACD trigger and CCI 'sell' suggest this rapid advance will consolidate soon, although bulls are likely to maintain the long term advantage.

Daily Market Commentary: Selling Intensifies

Image
After a series of relatively tight trading days, today opened up with a clear swing to sellers. Volume climbed to register distribution, but markets are really feeling for support following recent breakouts. Weakest was the Russell 2000.  It registered over an 1% loss as the measured pullback gave way to more active selling. Tomorrow will see how valued 1,180-1,182 support is for the index.  The CCI experienced an advance 'sell' signal.

Daily Market Commentary: Low Prices Rejected

Image
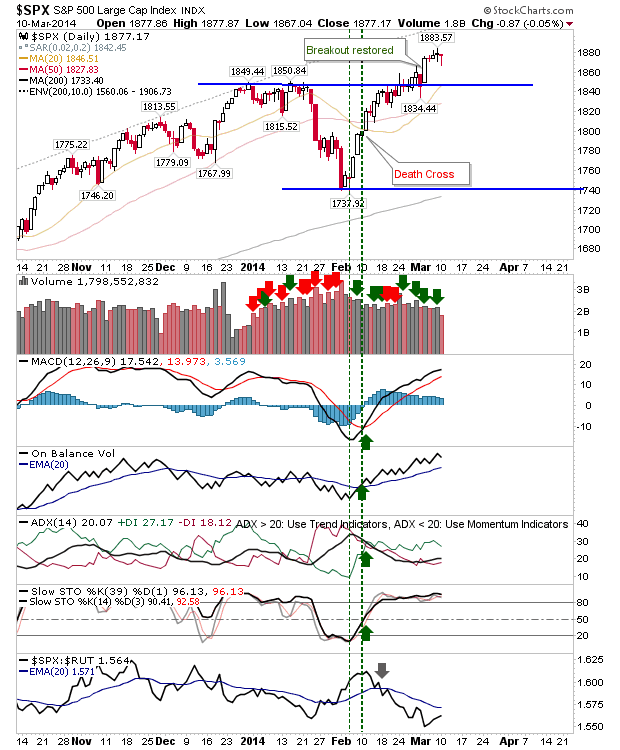
The second half of last week saw challenges of recent highs rejected (for the Russell 2000 in particular), but today it was the turn for bulls to repel the action of sellers. The S&P returned to its open price, although trading volume was light. Today's low is a place for stops, although buyers will want to see morning action hold above 1,877 to build confidence.

Daily Market Commentary: Bears Edge Friday

Image
Friday was a relatively disappointing day. The tight action of Wednesday and Thursday gave way to broader range day on Friday, but there was no strong swing one side or to the other - despite jobs data to spice the action. It only whipsawed traders who played the break of the mid-week narrow range. The Nasdaq was the only index to suggest there is a (slight) edge to bears.  Shorts may decide to take a sniff for a second test of breakout support. Stops on a break above 4,371.

Daily Market Commentary: Semiconductors Continue to Rally

Image
While the Nasdaq lost some ground by the close, it does have the help of an ever improving Semiconductor Index.  After years of underperformance, the Semiconductor Index is about to push itself into the rarified air of the blowoff run of 2000; the break of 550 should prove significant in the long run.  This will help fuel gains for the Nasdaq and Nasdaq 100.

Daily Market Commentary: Market Consolidation

Image
There was to be no comeback by bears after Tuesday's rally supreme. Bulls can take significant comfort from the narrow action near Tuesday's highs. Look for more of the same with  tight action offering a low risk swing opportunity: trade break of high/lows with a stop on the flip. The Russell 2000 offers a neat example of this tight range, although the strength of the move suggests bulls are more likely to win out in the days ahead.

Daily Market Commentary: S&P and Russell 2000 'Bull Traps' Blown

Image
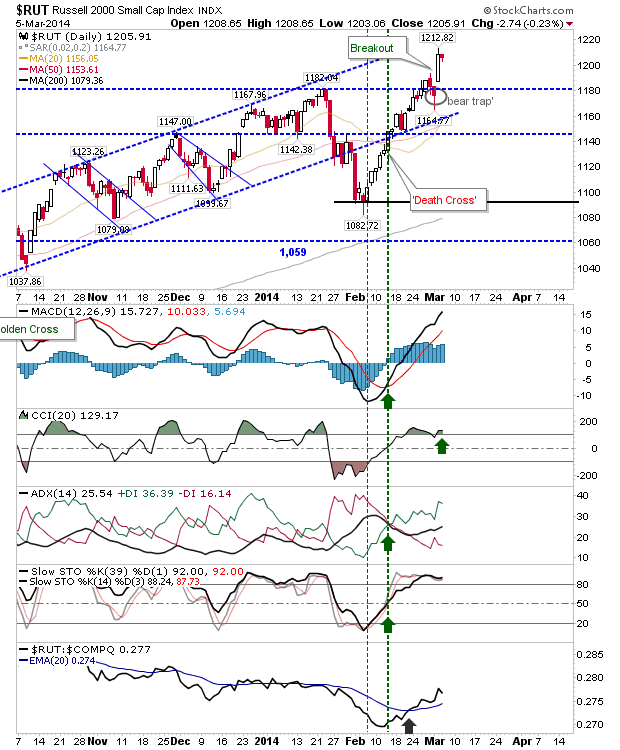
Well, it didn't last long. The 'bull traps' created in the Russell 2000 and S&P yesterday were dissected by today's open. It would have taken an aggressive short to jump in at the open. The new trading ranges established yesterday are probably still valid, even with today's breakouts. The boundaries of these ranges are likely to expand out, but in the near term it's hard to be a bear given markets are prepared to look past the events in Ukraine.

Daily Market Commentary: S&P and Russell 2000 'Bull Traps'

Image
Somewhat inevitable events in the Ukraine were going to nix the nascent breakouts for the S&P and Russell 2000. The net sum is to drop these indices into broad trading ranges for which a move to support (the January low) is perhaps the next move. A stop at a break of 'bull trap' highs is the protective stop.

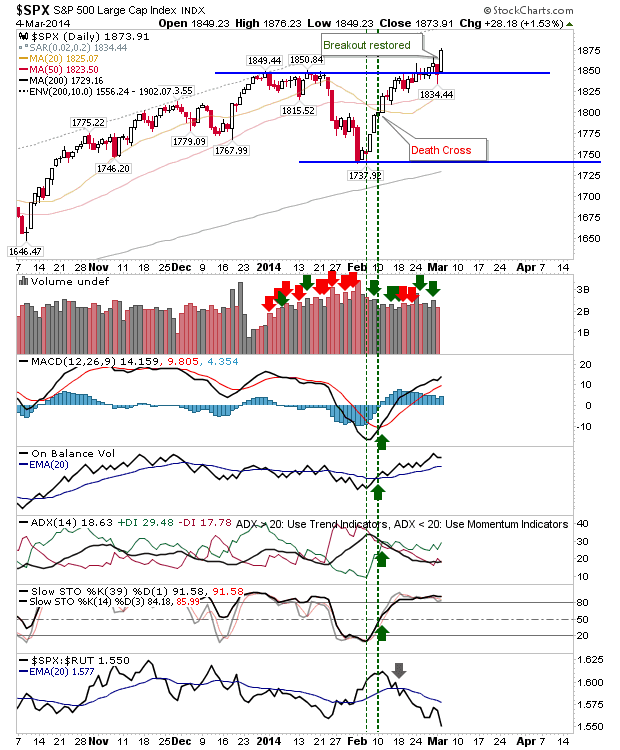
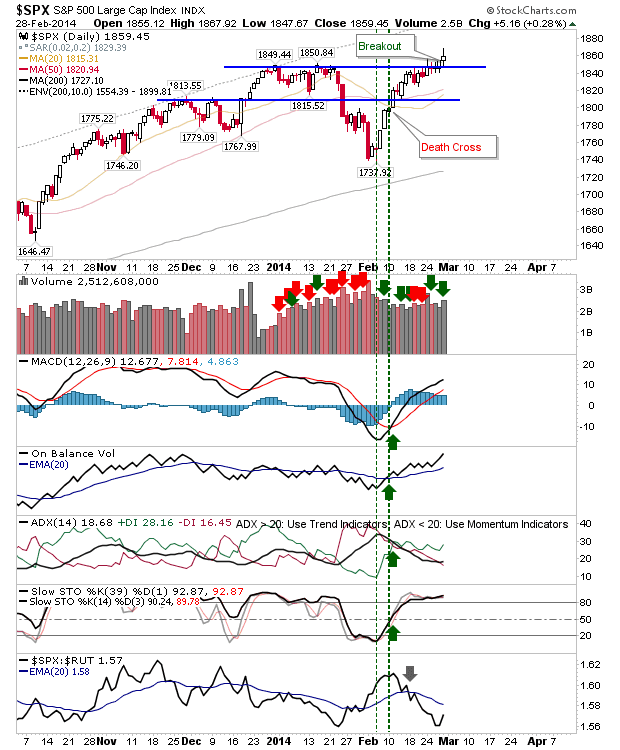
Daily Market Commentary: Breakout in S&P and Russell 2000

Image
The real breakouts occurred in the S&P and Russell 2000 on Thursday, although it was bit anti-climatic to see these indices make the push given the Nasdaq and Nasdaq 100 had broken out in the weeks before. However, it's important as it now has all indices pushing new highs, even if the Russell 2000 did lose ground on Friday to threaten its nascent breakout. The breakout in the S&P came in with higher volume accumulation, which suggests something more than the short covering which typically drives the early move. Technicals are good, but relative strength is sharply in favour of the Russell 2000 (and Nasdaq).

Archive

Show more