Posts

Showing posts from June, 2013

Daily Market Commentary: 20-day MAs Tested

Image
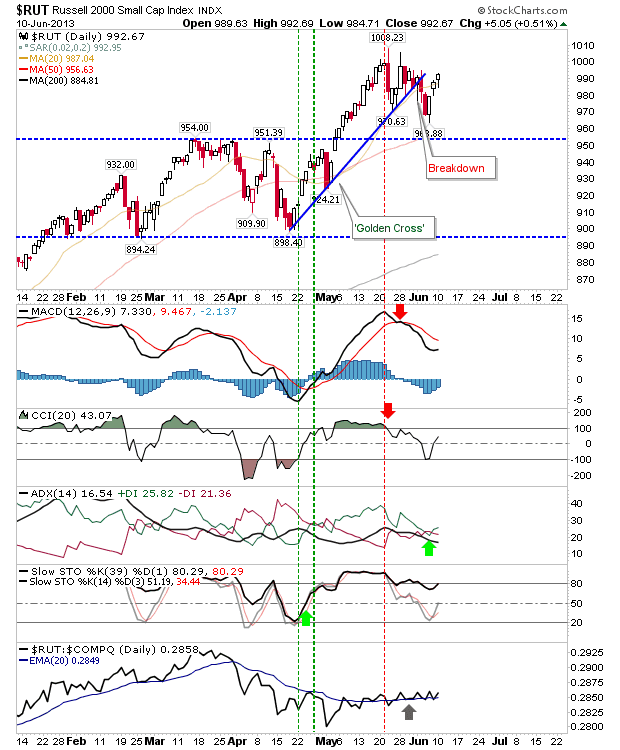
A good day for indices saw sufficient strength for 20-day MAs to be tested. The Russell 2000 had the best of the action; it gained 1.7% to close the gap to its 20-day MA and bring the index to former declining resistance (since weakened by the 'bull trap').  However, there was a more significant relative strength change towards Small Caps and away from Large Caps and Technology - this is a more bullish development if the rally can advance past the June swing high.

Learning to Trade: Charting the MACD

Powered by InvestingTeacher.com All Contributions Welcome - Thank You! Follow Me on Twitter Dr. Declan Fallon is the Senior Market Technician and Community Director for Zignals.com . You can read what others are saying about Zignals on Investimonials.com . JOIN ZIGNALS TODAY - IT'S FREE!

Daily Market Commentary: On Course To Test 20-day MAs

Image
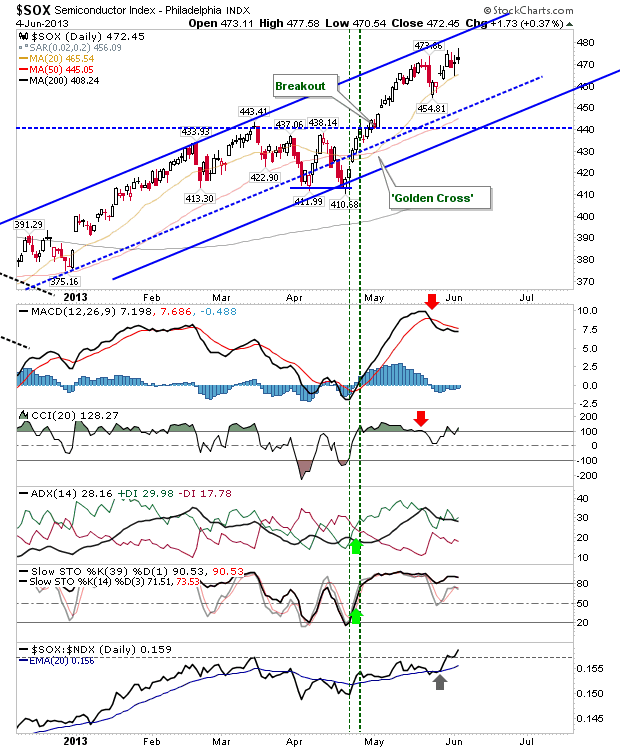
Markets continued their advance off Monday's swing lows, keeping things on course for a test of 20-day MAs (and for some, 50-day MAs).  One index has already tested its 20-day MA: the semiconductor index. It started the day just shy of its 20-day MA, but was unable to advance beyond it, closing just a few points lower. However, it is trading comfortably above its 50-day MA and channel support. How it fares tomorrow will govern how other indices react to it.

Daily Market Commentary: Good Day For Semiconductors

Image
Markets made a reasonable stab at recovering yesterday's losses. Markets gapped higher at the open, but they weren't able to build on the opening gaps. Small Caps edged the gain winners, adding just over 1% on the day. However, semiconductors had a very good day: adding 2.4%, closing above the 50-day MA and a minor channel support level - leaving behind a 'bear trap' in the process.  This should help the Nasdaq and Nasdaq 100 and offer a good opportunity for some upside follow through.

Daily Market Commentary: Indices at Horizontal Support

Image
Friday's buying was quickly unwound at the open following sizable gaps down. A late afternoon surge regained some of the lost ground, but indices still registered losses of over 1%. Not surprisingly, technicals continued their decline. Volume was heavy, but below that of Friday's. The S&P is caught in a bit of a no-mans land, but there is reason to suggest it could mount a rally to challenge its 20-day MA: daily technicals have crept into oversold territory and there is a nascent bullish divergence shaping up in the MACD histogram.

Weekly Market Commentary: Another Week Towards a Swing Low

Image
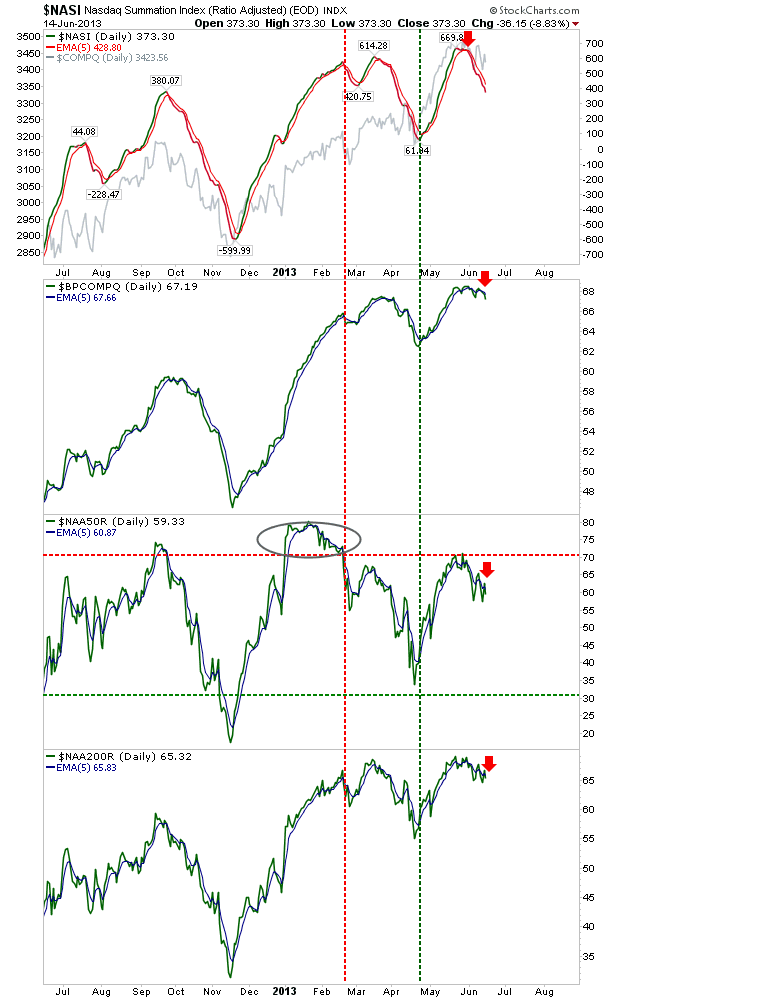
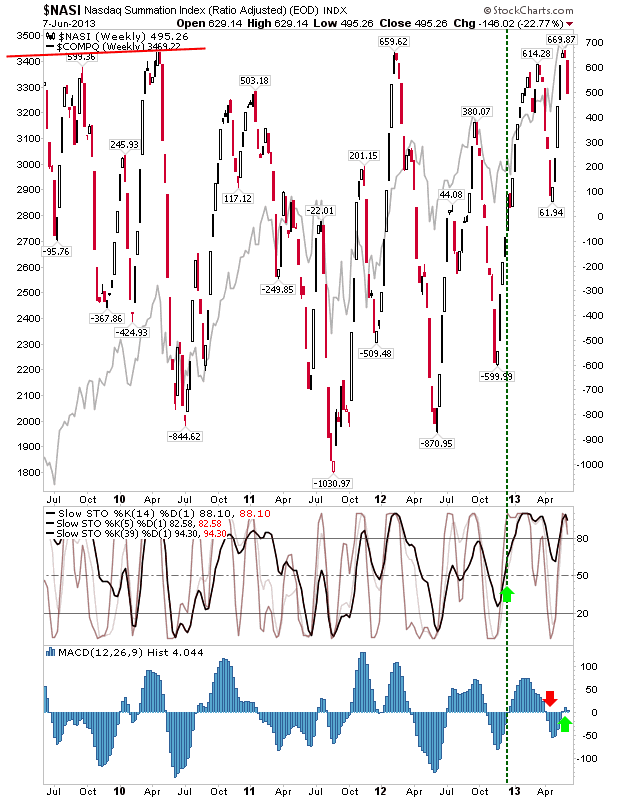
Last week's response to the Fed nixed the attempted recovery in breadth metrics.  The Nasdaq Summation Index was the one breadth indicator not to react to the Fed, and is some way from entering swing low territory: it hasn't even entered negative territory.

Daily Market Commentary: No Room For Bulls

Image
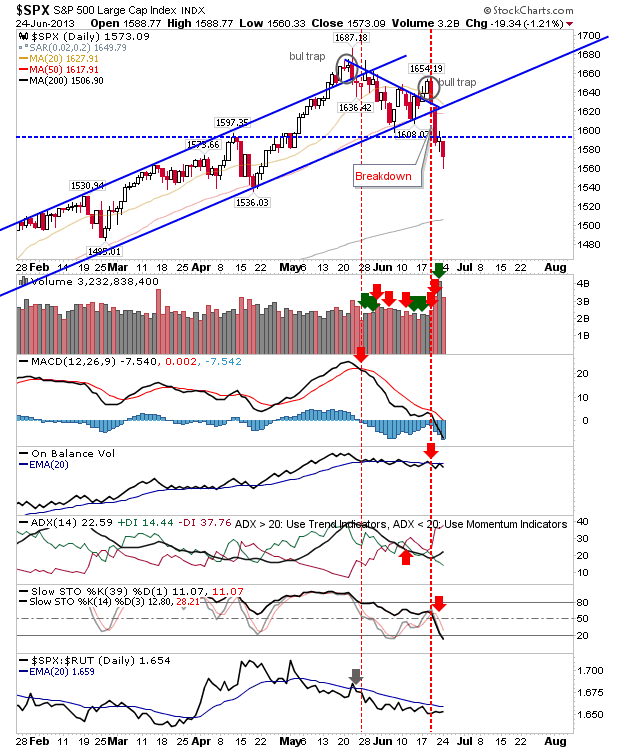
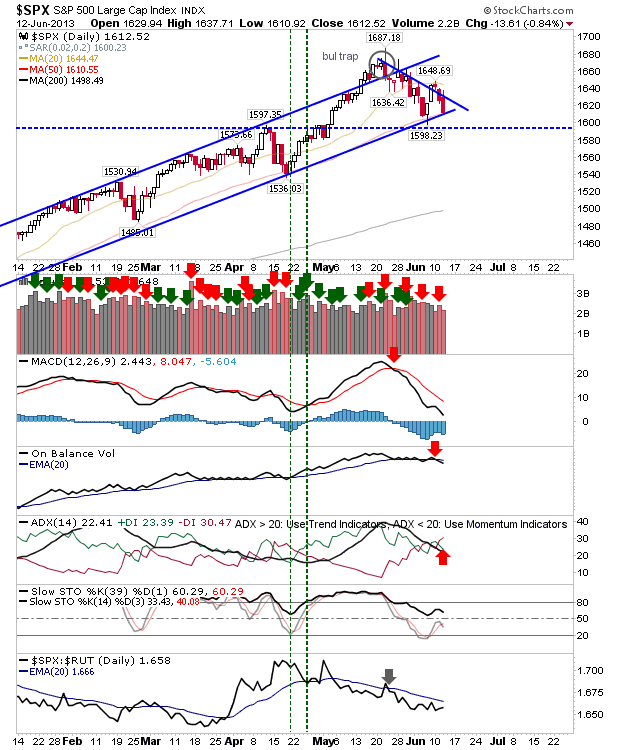
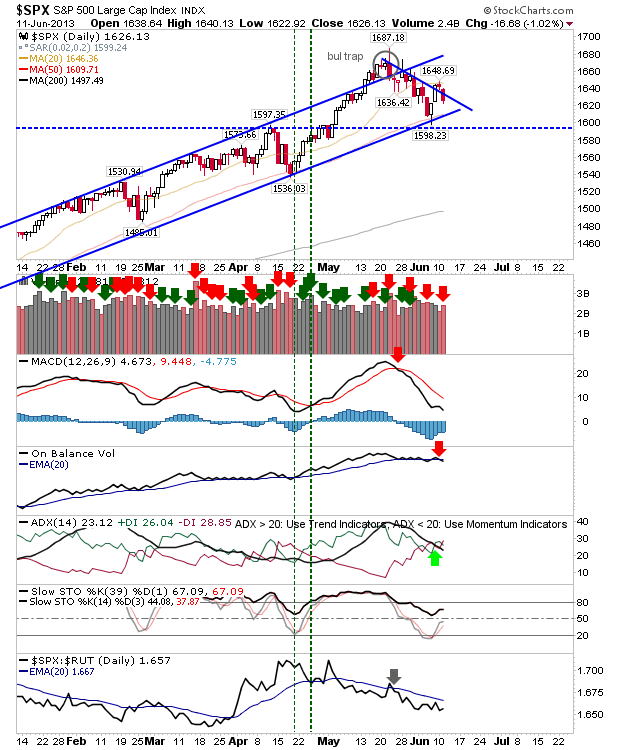
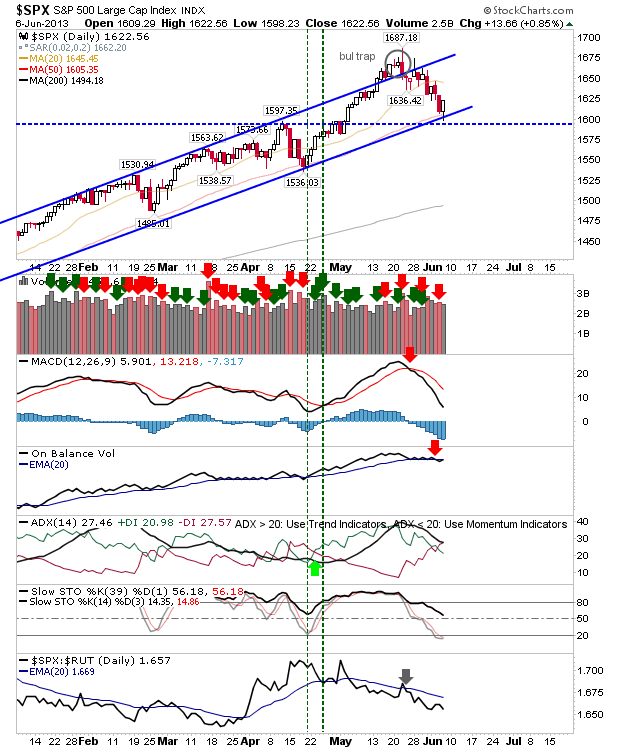
Well, in the end there wasn't much bulls could do. The day opened weak and just got worse as the day wore on. There was a clear slice of channel support where such support existed. In addition, volume climbed to register a firm distribution day. There is probably 2-3 days of gains required just to make back what was lost today - and today was a big miss. The S&P overshot horizontal support at 1,597, which may offer a point of defense tomorrow.  If this was the case, I suspect it will be a late morning rally which does the leg work in some form of bullish piercing pattern. However, technicals turned net bearish on the sell off.

Daily Market Commentary: Watch for Bull Traps

Image
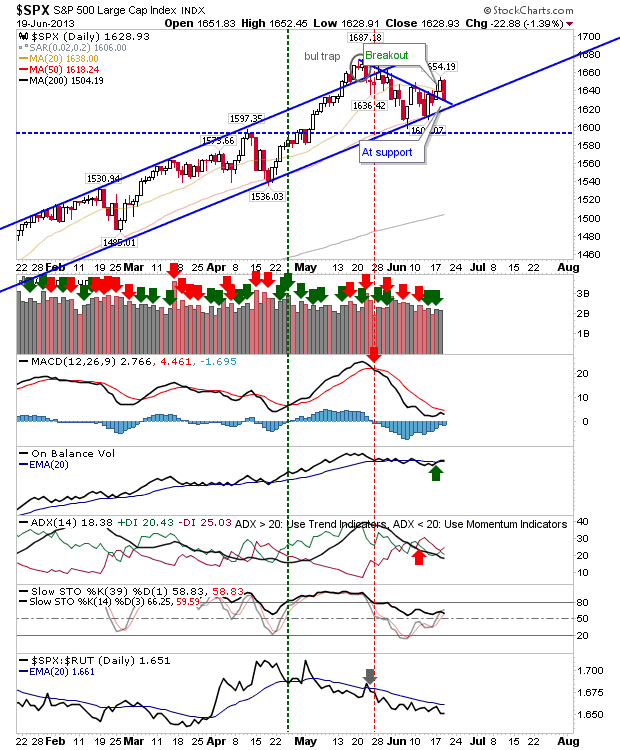
The Fed induced sell off undid the gains generated by bulls yesterday, but the selling wasn't enough to write off the breakouts altogether. However, another day of selling tomorrow will lead to breakout failure, trapping those buyers. Bulls aren't totally out of the picture - the breakouts haven't failed, and indices are closer to support. Buying at the open with a tight stop could be an interesting day trade: the S&P illustrates the long side potential with a stop on a break of the 50-day MA which is also channel support.

Daily Market Commentary: Low Volume Breakouts

Image
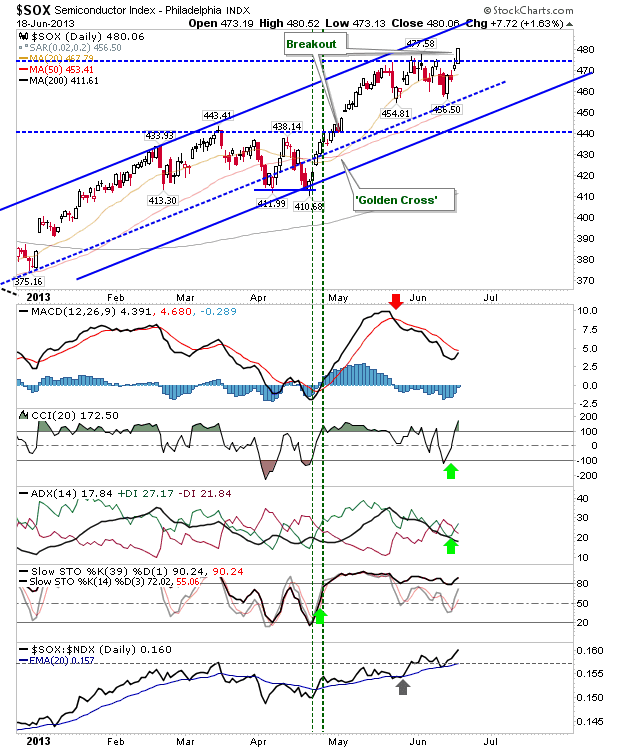
In the run up to today's Fed announcement, markets made an early break past resistance - following the S&P's lead, which made its break on Monday. The semiconductor index posted the most significant move, as it was able to close at a new multi-year high. The gain was enough to reverse the bearish cross is +DI/-DI (although with a weakening ADX, the importance of such a cross is reduced).  The break is also good news for the Nasdaq and Nasdaq 100, as they seek to make new multi-year highs of their own.

Daily Market Commentary: Decent Attempt By Bulls

Image
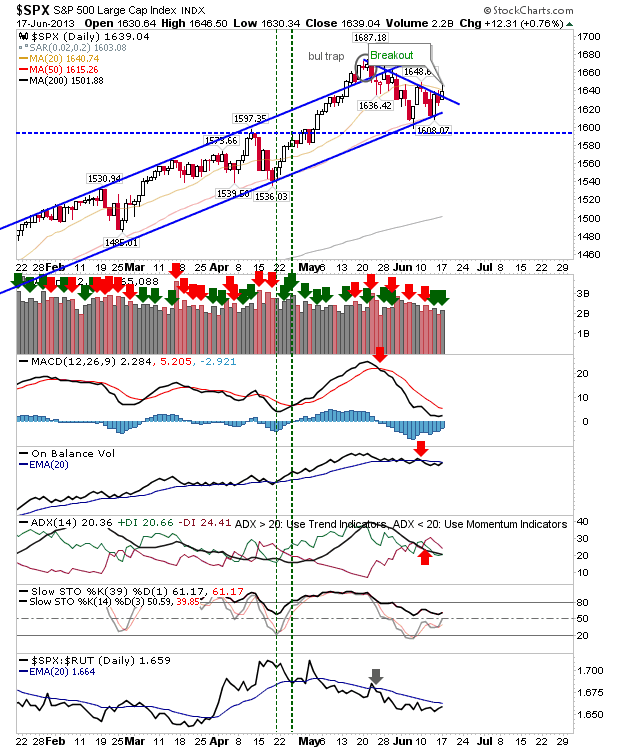
Okay, bulls couldn't hold all of their gains by the close of business, but their attempts at breaking the consolidation still have merit.  None of this changes the overbought condition of breadth metrics , but it suggests a mini-rally could emerge before breadth is again in heavily overbought territory. The S&P managed to edge a break of declining resistance on confirmed accumulation. Bearish technicals remained bearish, but the net technical picture is still bullish.

Weekly Market Commentary: Breadth Still Favours Bears

Image
While Thursday's rally favoured bulls, with buyers jumping in at channel support for the S&P and 50-day MA for S&P and Dow, Friday took some of this gloss off - but didn't reverse all of the gains.  However, market breadth remained in the bearish camp, with breadth metrics either overbought (Bullish Percents) or declining (Summation Index).

Daily Market Commentary: S&P at Channel Support

Image
Sellers kept the pressure on, but volume was lighter than yesterday. The S&P finished at channel support and will find itself under pressure tomorrow. Technical weakness expanded with a 'sell' trigger between +DI and -DI.

Daily Market Commentary: Sellers Edge It

Image
Yesterday's highs remain the risk metric for new short positions. Bulls were unable to maintain their late morning advance after opening gaps down across the indices. Until such highs are broken, the near term short position remains favoured. The S&P saw increased volume in confirmed distribution.  It was accompanied with a 'sell' trigger in On-Balance-Volume.  In the near term, there is an upcoming convergence between declining resistance and rising support of the channel.  Channel support is also aided by the 50-day MA. Support should be stronger, but take nothing for granted!

Daily Market Commentary: Low Volume Action

Image
No real surprises with today's trading: narrow action on light volume.  The biggest gainer was the Russell 2000, but it remained below rising support and the swing high.

Weekly Market Commentary: Recovery Too Little Too Late?

Image
Despite a solid Thursday/Friday there are warning signs to suggest the recovery is not all it seems.  For the Nasdaq Summation Index it was a straight down week from an overbought state.

Daily Market Commentary: S&P Channel Support Holds

Image
The S&P lived up to its potential with a defensive rally off the 50-day MA / channel support (take your pick). Next test is channel resistance at the 20-day MA. Technicals likely to turn net bearish tomorrow despite bullish recovery.

Daily Market Commentary: Selling Continues, S&P Down at 50-Day MA, Russell 2000 Fails To Hold 20-Day MA

Image
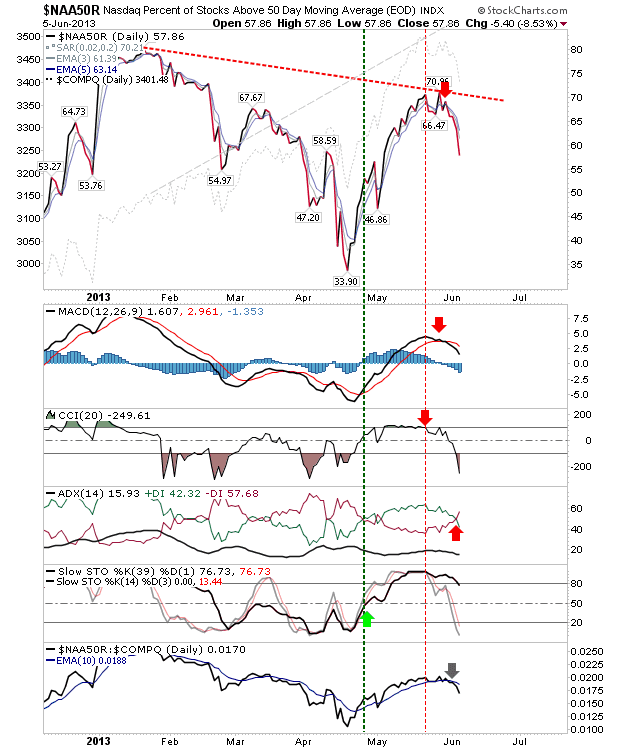
Just a quick update as I didn't do a post after the market close yesterday.  Selling continued to drive markets lower, confirming a large negative divergence in Nasdaq breadth (Percentage of Nasdaq Stocks above 50-day MA) with increasing technical weakness.

Daily Market Commentary: Losses offset Yesterday's Gains

Image
Yesterday's bounce didn't last long as indices struggled to defend 20-day MAs. Only the semiconductor index is showing some backbone in this regard, although it's working off a MACD trigger 'sell'.

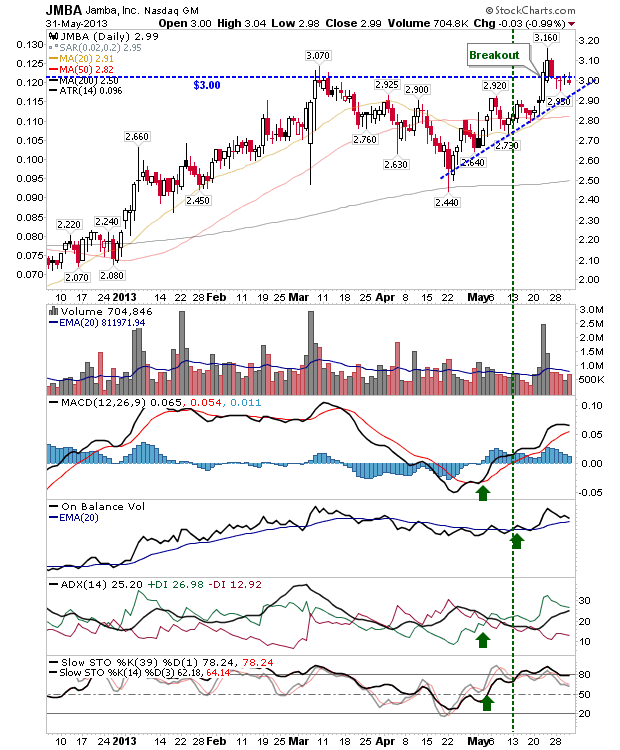
Stock Picks: $JMBA, $MELI, $NLS, $SB, $WFT

Image
The following stock picks were discussed since the last update. Fundamental reviews are available from the links provided. Jamba Inc ( JMBA )

Weekly Market Commentary: Breadth Overbought Once More

Image
The push from the April swing low (in the Nasdaq) was premature in breadth indicators had not reached oversold conditions, so it hasn't taken the long for breadth to again become overbought.  However, the recent similarities to March suggest this may prove nothing more than a pullback of the larger advance, although more downside is needed to at least take the heat out of the breadth indicators.  Ideally, a more substantial decline would push breadth indicators into a situation where a tradeable (buy) low would emerge, but this will take a while.

Archive

Show more