Posts

Showing posts from June, 2015

No Update

Stockcharts.com running very slow, so no update today.

Greece Strikes Back (or was it China?)

Image
A doubly whammy of weakness from Asian and European sessions left bulls with little room to stretch their legs. Not surprisingly, there were few willingly to make a commitment so bears had the market to themselves.  The good news is that today's decisive selling pushes markets out of their stiffing ranges. The S&P dropped below 2080, and is knocking on the door of 2040. Technicals are again net negative. The 200-day MA at 2053, just above the 2040 level, may play a role in tomorrow's action. While the Dow has already indicated a break from the March/July range. The Nasdaq gapped out of its bearish rising wedge. Lots of room down to the 200-day MA available. Shorts may look to attack rallies back to 5038. While the Semiconductor Index suffered another big hit. It's trading down at its 200-MA having crashed out of its range. The reversal in the Russell 2000 has left behind a 'bull trap', although this has dropped it back inside the prior ran

Further Selling, But Breakouts in Tech and Small Caps Hold

Image
More losses, but breakouts in Tech and Small Caps hold for another day. However, there is no more wiggle room for these breakouts, Large Caps are already under pressure. The S&P is inside its range and technicals have started to waiver with a 'sell' trigger between +DI and -DI.

Sellers Pressure, Nasdaq 100 Shorting Opportunity

Image
Again, too-and-fro the markets continue their dance. Despite the selling, there was no handing of control over to bears. The S&P ducked below 2120, but key resistance is at 2,134. Technicals kept their net bullish technical strength

Honors Shared

Image
Today was a big non-event. There was probably hope for more from the Greece story, but a stay of execution keeps things ticking over for another couple of days. The S&P was kept pegged below 2,135, but maintains its trendline breakout.

Low Volume Gains

Image
After Friday's options expiration it was left to bulls to pick up the pieces of Friday's distribution selling. Large Caps were able to erase Friday's losses. In doing so, the S&P regained its net bullish technical picture. The Nasdaq banked most of its gain by the open, but it did enough to leave a decent amount of wiggle room to breakout support.

Large Caps Suffer Heavy Selling

Image
Large Caps suffer heavier selling; not enough to break the declining resistance trendline, but enough to register as distribution in one of the heaviest sell off days for 2015. Part of this volume was down to options expiration, but not enough to account for all of it. The S&P has mixed technical strength, and remains range bound by larger support and resistance between 2040 and 2135.

In The End, It Was No Contest

Image
It was a 50:50 play going into the cash open, but in the end there was only one winner. Bulls swept the board, driving what shorts in play into covering their position. Leading the charge was the Russell 2000. It came out of the top of the bearish wedge - negating the double top - while maintaining the relative leadership role it holds against the S&P. Now it needs to put some distance from this new found support.

S&P at Resistance

Image
Yesterday's gains in the indices were able to add a little more upside before coming up against resistance. The S&P finished in the crux of former rising support, declining resistance, and the 50-day MA. Volume declined with technicals net bearish. Tomorrow is decision time for the index: break declining resistance and a retest 2,134 opens up, reverse, and a move to the 200-day MA comes into play. The Nasdaq 100 finished at former bearish wedge support, turned resistance. Despite bullish volume accumulation, technicals remain negative. However, the Nasdaq did enough to regain rising wedge support on yesterday's gain, redrawing support and shifting the index back to neutral. Volume also climbed to register as accumulation. The rally in the Russell 2000 is morphing into a bearish wedge and is fast approaching resistance at 1,278.  Unlike other indices, it lost a little ground to yesterday. While the index is outperforming the Nasdaq and S&P, technicals lik

Sellers stick around for a second day

Image
There was a bit of a hangover to Friday's selling with opening action pushing more downside. However, buyers were able to dig in at yesterday's lows. The S&P found support at 'bear trap' support at 2,072, although technicals are again net bearish. The real need is for the S&P to get out of its 2080/120 range.

Sellers Return

Image
Profit Takers return after a two days of buying.  The selling remains confined to broader trading ranges, which remain dominant until breached. In the case of the S&P there is 'bear trap' support at 2,080 and resistance at 2,115 to consider. Friday's action let it in the middle of this range, just below the 50-day MA. Volume was lighter, which weakened the importance of the selling. The Nasdaq is easing back to converged wedge support and 5,038. As with the S&P, trading volume was lighter. Bulls may get some joy with a bounce off converged support with the index close to new all-time highs. The Russell 2000 cleared the tentative downward channel. Friday's action retesting the channel with a neutral 'doji'. Monday could see a drop back inside its channel, but should it do so then the presence of converged 20- and 50-day MA support (1,252/4) could offer the opportunity for bulls to mount another round of buying. If there is an index which

Tag of Resistance for Indices

Image
After yesterday's action it was positive to see indices hold their gains. The Russell 2000 had a breakout to protect, and it did so with ease. The 'bull trap' from April will be under pressure if tomorrow sees more gains.

Support Kicks In, Russell 2000 Breaks Again.

Image
A good day for markets saw buyers turn up in decent numbers, although given the relative gain it would have been good to have seen volume a little stronger. The Russell 2000 had the best of the action, breaking out of its readjusted channel as it continues to outperform both S&P and Nasdaq indices.

Pause in Decline

Image
A day where the status quo was the end-of-day result after yesterday's selling. This is set up nicely for a rally tomorrow, even if some indices lack a natural support level to work off. Also favouring longs is the lighter volume selling which accompanied today's action. The S&P is net bearish at a technical level, but may find some traction at a minor swing low of 2,067.

S&P Breaks Trendline Support

Image
The trendline in play for the S&P from March was breached on higher volume distribution. However, the index remains inside a secondary trading range bound by 2,040 and 2,130. Technicals are also net bearish.

S&P Holds Trend Support, Russell 2000 Regains Breakout

Image
A mixed bag of action. The S&P finished Friday bang on trend line support. The equivalent trendline which was breached as support in the Dow. However, Friday saw higher volume distribution for the S&P, but not the Dow. The S&P saw a net bearish turn in technicals, which followed an equivalent turn in the Dow.

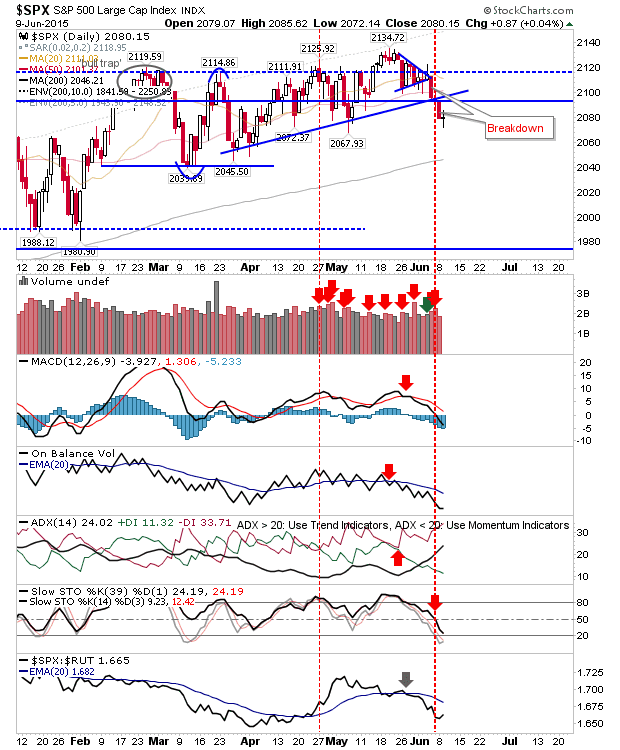
Breakdown From Pennant in S&P

Image
Yesterday, the Russell 2000 broke past resistance. Today, the S&P dropped out of its consolidation pennant, finishing on trendline support. Volume rose to register distribution with only stochastics holding on to bullish momentum. If there is a positive it's that today finished at converged support; tomorrow may be the bulls last chance to make a run to 2,120 unless a more protracted consolidation emerges.

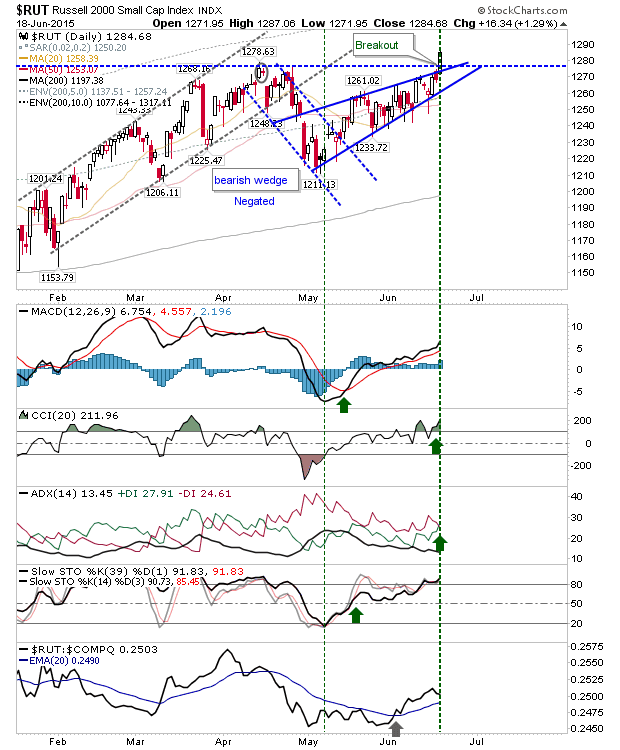
Small Caps Breakout

Image
In a low key move, the Russell 2000 broke from its channel in a relative swing in favour of Small Caps and away from Tech and Large Caps. This is important development for bulls looking for a larger push outside of 2015 consolidations for range bound S&P, Dow, Nasdaq and Nasdaq 100.

Archive

Show more