Posts

Showing posts from January, 2024

Day Trade in Nasdaq 100 delivered; what next?

Image
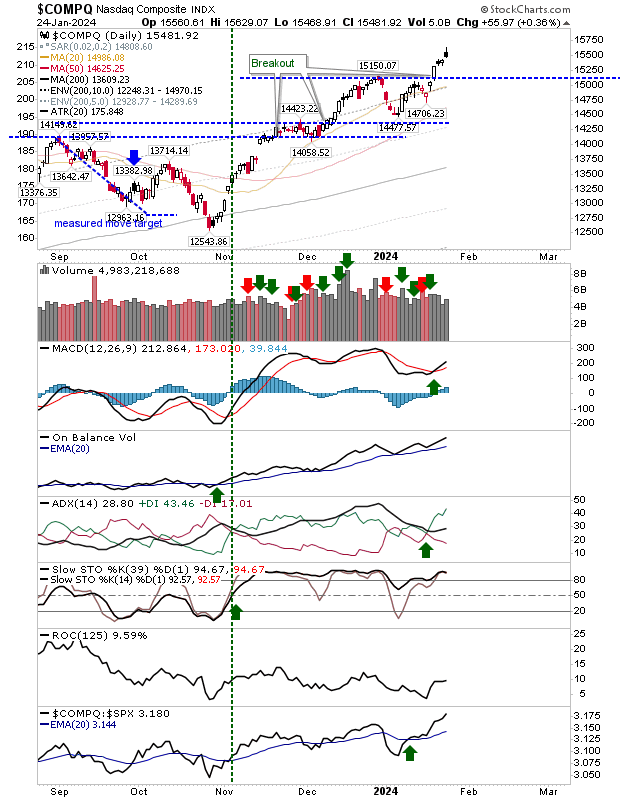
It was a nice trade if you banked it for the Nasdaq 100, although all indices did well. Harder to know what may come next, but a challenge of the January 24th high looks a good prospect for the former index.

Day Trade Suggestion: Buy Nasdaq 100

Image
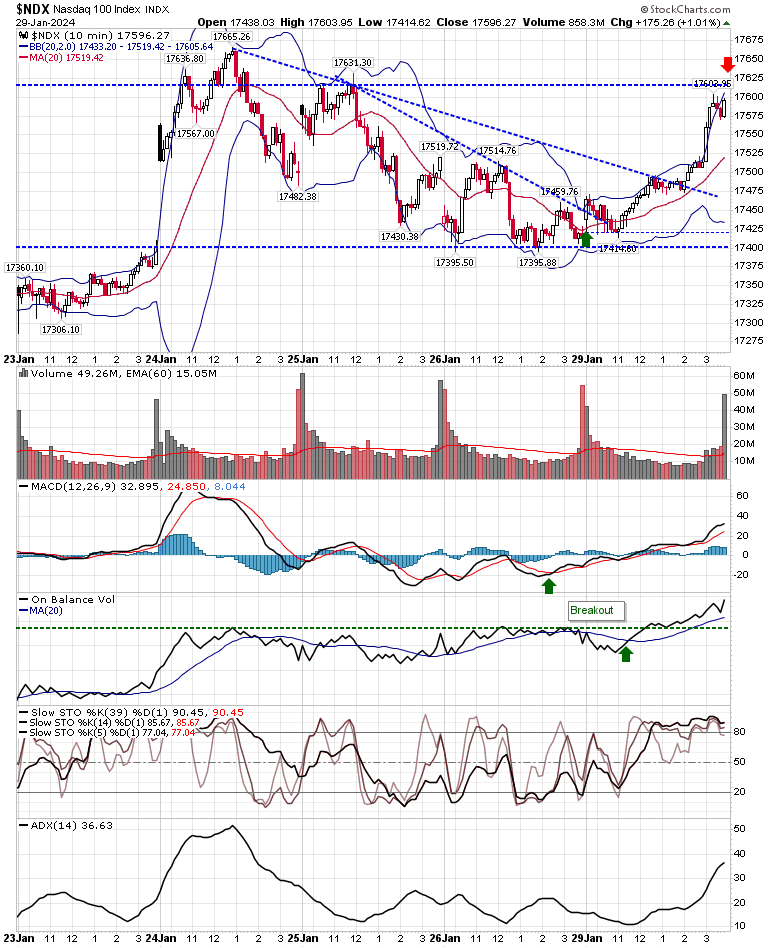
My experiment in day trading continues. Having burst out of the gates with some good success I have found myself treading water the last few weeks. Tomorrow offers an opportunity to get out of this rut. There is no significant economic data to move the needle, so action should be more technical in nature. The Nasdaq 100 ($NDX) closed the price gap from January 24th in a successful test of support, but also registered a breakout in On-Balance-Volume accumulation. Momentum is oversold and the MACD is working off an earlier 'buy' signal, although a it's a signal that triggered below the bullish zero line, so it's a "weak" buy. However, collectively, I'm optimistic for a long trade near 17,400 if you can get it with an initial target of 17,600 - although I suspect it will go higher (for a number of days).
Profit Taking Strikes Indices

Image
Early buying momentum from pre-market through to morning trading had the potential to stamp bulls authority on markets, but by the close we are again looking at bearish 'black' candlesticks for the Nasdaq and S&P, with a bearish 'cloud cover' for the Russell 2000 ($IWM). For the Nasdaq, we are perhaps looking at an opportunity to test breakout support of 15,150 although this process will likely take a 2-3 days of selling to achieve. Tomorrow is a logical place for this selling to start. Technical strength is bullish with little in the way of bearish divergences to indicate pending weakness, so it will be down to pre-market to determine if there will be a gap down.

Russell 2000 ($IWM) takes Monday's plaudits

Image
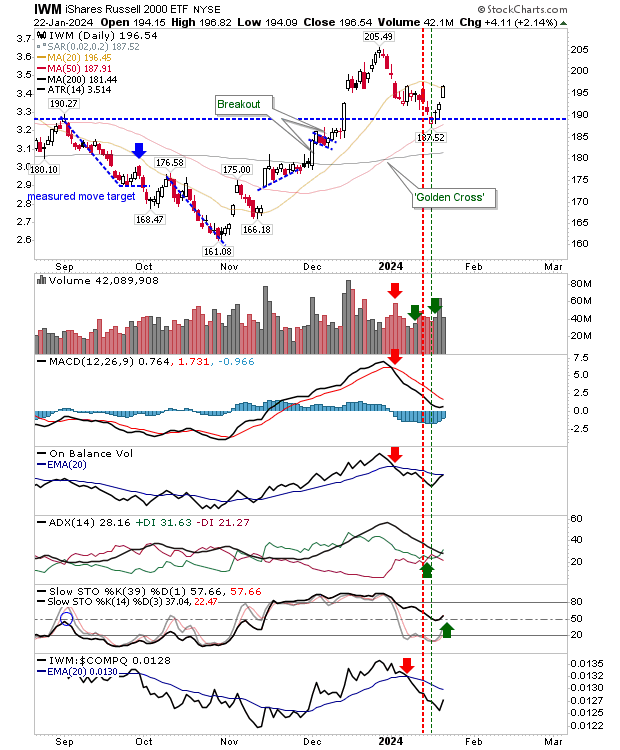
It was not a great day for my day-trading experiment as I got stopped out of my Russell 2000 long position, but it was the Russell 2000 that banked the best gain of the day. Buying volume was below Friday's but the index was able to close above its 20-day MA. Intermediate stochastics found support at the mid-line, and On-Balance-Volume is about to trigger a 'buy' signal, although it will be a few days before the MACD follows suit.

Weekly charts got big boost on Friday's gains in markets

Image
There was some concern heading into Friday that Thursday's gains were going to be clawed back, but I was surprised by the extent of the buying that did show up. The Nasdaq and S&P had the best of the action. The S&P made a good "clean" breakout, ending the bear market kicked off at the end of 2021. The weekly buying volume was a little below par, but it was the price action that was most welcome. Weekly technicals are very strong - note the new high in on-balance-volume. Buyers are keen to get involved, although it comes at the expense of Small Cap stocks.

Strong finish may have come a day early for indices

Image
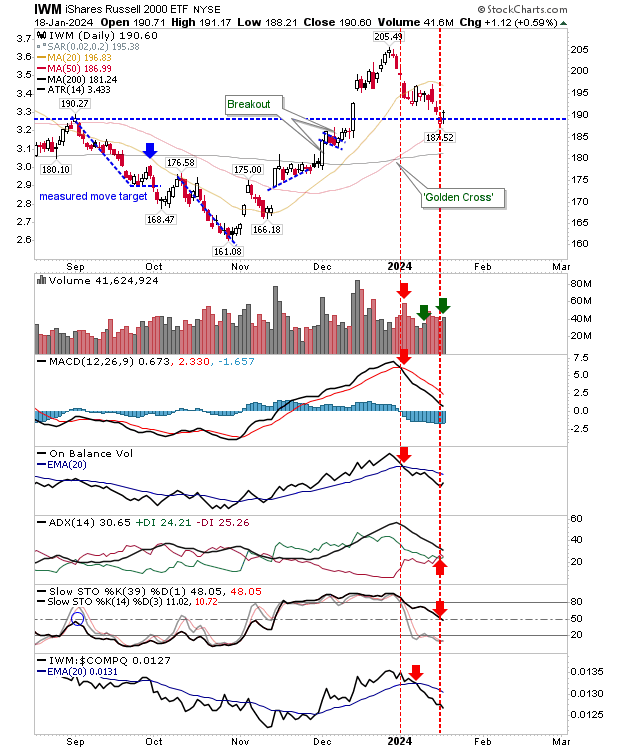
It was a good day for bulls and I wish it was banked on Friday rather than today so that weekly candlesticks had a good finish. Instead, tomorrow will be a bit of a nail biter to ensure by close-of-business markets finish as good as, if not better, than they did today. The Russell 2000 ($IWM) might offer the best chance for bulls. Yesterday delivered a positive test of the 50-day MA, but today's rally closed with an indecisive doji. It was a bit disappointing to see this kind of doji so soon in a bounce. Volume climbed to register as bullish accumulation but the trend indicator ADX, has switched to a new 'sell' trigger as had intermediate term stochastics, following earlier 'sell' triggers in the MACD and On-Balance-Volume to leave technicals net bearish. The relative underperformance of the index to the Nasdaq accelerated. What I do like that the index found support defined by the September swing high.

An expected weak start leaves indices primed for further selling

Image
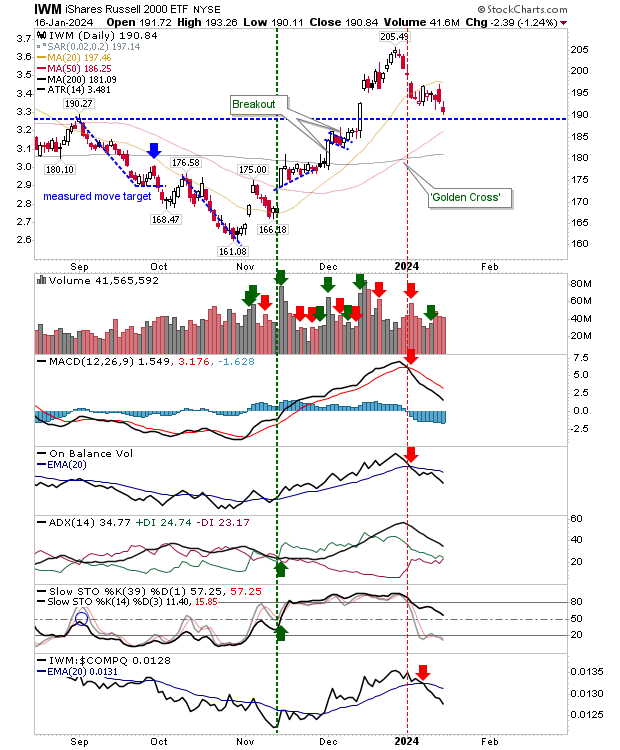
A short week for indices has opened with some modest selling, hardest felt in the Russell 2000 ($IWM), but common across all lead indices. The Russell 2000 ($IWM) gapped down but hasn't yet tagged support marked by the September swing high. There is the current 'sell' trigger in the MACD and On-Balance-Volume offset by the bullish momentum for intermediate term stochastics, but given today's action I would be looking for a likely intraday move down to the 50-day MA, although it may be late this week or early next week before this happens.

Weekly charts offer optimism, but there was a weak finish for indices on Friday

Image
The good work of bulls was done early in the week but rallies had run out of steam by Friday's close, although the weekly charts still look good. On weekly timeframes there was registered accumulation for the S&P and Nasdaq but not for the Russell 2000 ($IWM). The Russell 2000 ($IWM) did close with a doji on the weekly timeframe and in a position to suggest a bullish (reversal) harami cross while also resting near support of $195.

S&P approaches highs as Russell 2000 treads water

Image
A bit of a mixed bag for indices. Large caps had the best of the action as the S&P and Dow Jones Industrial approached all-time highs. Buying volume for Large Caps indices didn't count as accumulation, but these indices are outperforming its peers.

Solid buying kicks off the development of indices swing lows.

Image
It was a good start to the week across all indices as buyers began the day in buoyant mood and didn't let up all day. If there is a caveat to the buying it was that there was little in the way of a pause or a test of buyer resolve over the course of the day. Volume was down for the Russell 2000 ($IWM), although the Nasdaq ($COMPQ) and S&P ($SPX) registered as accumulation days. The S&P ($SPX) recovered its 20-day MA with technicals unchanged, but improving.

Lows hold as a swing low takes shape

Image
Markets managed to hold on to early lows without the selling pressure of earlier in the week. While the buying was relatviely modest, it still wasn't enough to see a return above 20-day MAs for indices, although there is a good chance for a second bite of the cherry this week. For the Russell 2000 ($IWM) there was an "inverse hammer" at oversold near term stochastics, but not at mid-level intermediate stochastics - a level often associated with support during bull markets. There are 'sell' signals in the MACD and On-Balance-Volume to overcome but other technical supports are healthy.

Tests of 20-day MAs for Russell 2000 ($IWM) and S&P ($SPX)

Image
The Russell 2000 ($IWM) and S&P ($SPX) both finished near their respective 20-day MAs registered as test "fails", but not enough to suggest a recovery isn't possible tomorrow. The Russell 2000 does have the August swing high to lean on should it need it. Also, the closure of the December gap can be one to spark a recovery.

Markets start 2024 near (all-time) highs

Image
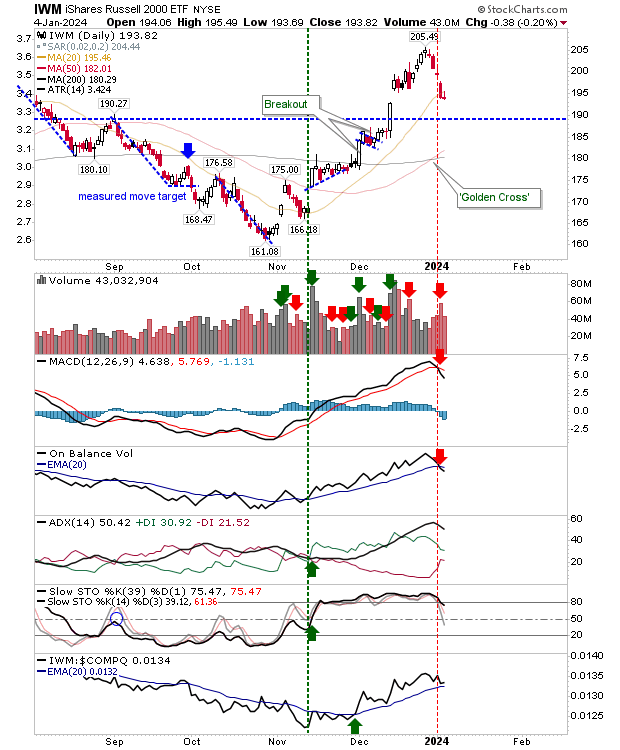
With the exception of the Russell 2000 ($IWM) we have the S&P, Dow Jones Industrial and the Nasdaq all up near all-time highs. There is the potential for some indices to return double tops, particularly if you look at Monthly charts like the S&P.

Archive

Show more