Posts

Showing posts from November, 2021

The week starts with weakness for the Russell 2000

Image
Not the best of starts for the Russell 2000 as the opening gap higher drifted back into a lower close.  The finish was still enough to register support of the 200-day MA, but as long as sellers keep feeding piranha style on the carcass it will struggle to recover.  The index did enough to hold on to the 200-day MA but technicals remain net negative but stochastics are not yet oversold.        

Was Black Friday Selling Meaningful?

Image
Holiday trading rarely marks the start of a major trend change as junior traders look after desks until their bosses return from the holiday.  But bosses won't be happy with the shift their minions have put in over the Thanksgiving weekend.  Last Wednesday's gains do feel like a long time ago. The Russell 2000 is the barometer for the broader market. It really has no more room for maneuver as the index gapped down to its 200-day MA with technicals net bearish.  Relative performance has also moved sharply against it relative to the Nasdaq and S&P.  Volume climbed to register as distribution, adding to the misery.  After waiting so long for the breakout in 2021, the index now finds itself looking in the other direction. 

Russell 2000 attempts to defend 50-day MA

Image
Indices pushed to reverse yesterday's losses with respectable gains. Best of the indices was the Russell 2000.  Despite been unable to hold breakout support it has managed to defend its 50-day MA - at least for now.  Technicals, aside from stochastics [39,1], are bearish - but those intermediate time frame stochastics are finally at a level where swing low support typically kicks in for an asset in a bull market. This confluence of support might be the recipe to save Small Caps and put a stop to the selling. 

Bearish engulfing patterns strike markets

Image
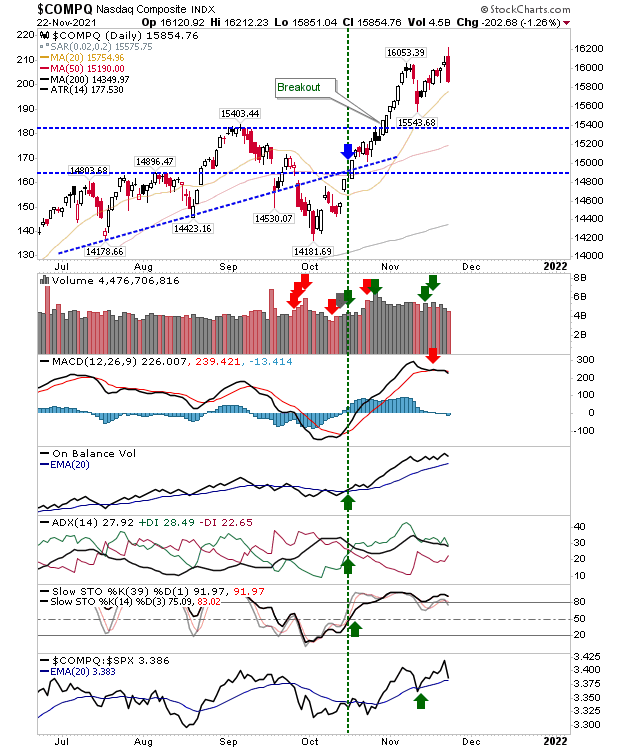
The week started with bearish engulfing patterns for all indices. Hardest hit was the Nasdaq as it failed to hold on to morning gains triggered off the gap.  The drop was attributed to Jerome Powell's second term appointment, but the double top off resistance offered a more technical signal.   The Nasdaq is primed to retest 15,550 after failing to hold new all-time highs. Selling volume registered as distribution, but aside from the MACD 'sell', the technical picture was unchanged.

Support test in the Russell 2000

Image
All action appears to be focused on the Russell 2000 as it drifted toward breakout support as other indices protect their swing low rallies. The Russell 2000 nearly tagged $232 breakout support on today's spike low, but rallied back to its 20-day MA by the close.  In the case of the Russell 2000, where volume spiked it did so on days of distribution selling. We now have 'sell' triggers in the MACD, On-Balance-Volume and ADX.  Not surprising, relative performance has shifted away from the Russell 2000 towards Tech and Large Cap indices. 

Nasdaq outperforms Russell 2000 and S&P

Image
Since October there has been a back-and-forth tussle in the relative strength leadership between the Nasdaq and Russell 2000.  The Russell 2000 awoke from its slumber at the start of November and this helped drive the broader rally across markets as it adopted a leadership role.  The breakout in the Russell 2000 has since drifted into a consolidation, and this stall has returned a leadership opportunity back to the Nasdaq and S&P - one which the Nasdaq is taking.  The Nasdaq has bullish technicals and a relative uptick against Small and Large Caps. Today's gain didn't reach 1% or register as accumulation, but it's getting closer to challenging the November peak high of 16,053. With buyers pumping money into the index it may be the first to make new all-time highs. 

Markets attempt to build a swing low

Image
It was a troubling week or bulls as the long standing sequence of gains banked since late October gave way to a couple of days of sharp profit taking.  Friday's action attempted to draw a line under this selling but it remains to be seen how effective this will prove to be in the weeks ahead.  On a positive front, buying volume ranked as accumulation across lead indices.  The Nasdaq closed the small gap between Tuesday and Wednesday's sell off, but it might have a harder time getting above last week's highs, which were initially marked by the neutral doji at peak high of 16,053. Technicals are nicely positive and while the index hasn't yet regained its relative leadership role vs the Russell 2000 it has made up some ground on it. 

Markets work on breakout support tests

Image
Sellers struck for a second day as the Nasdaq and S&P experienced the first real pull back since rallying off October lows.  There is still a few days before we get to test breakout support but what we have so far is healthy - especially as selling volume has come in below prior buying.  The Nasdaq will likely make it back to support first. 

Indices take a breather in preparation of breakout support tests.

Image
After last week's strong gain we had a quiet start to the week with indices finishing the day much where they opened.  The one index which may be blinking a little is the Russell 2000.  The index closed with a bearish black candlestick, but even if this plays as true it will only initiate a breakout retest.  There is plenty of room to absorb some weakness without breaking the bullish thesis. 

Indices finish week with sharp gains

Image
Indices enjoyed excellent gains last week, but the rate of market ascent is not one which can be maintained in the long run. How markets consolidate over the coming week will say much about the strength of these - very positive - breakouts.  The Russell 2000 finished with a neutral candlestick but the buying of last week came with three heavier days of accumulation.  There was a relative performance uptick versus the Nasdaq to go with these gains.

Russell 2000 continues its advance

Image
The Russell 2000 advanced on the second day after its breakout.  Volume climbed to register as distribution with technicals net positive.  All indices gained, but relative performance of Small Caps remained ahead of Large Cap indices. The current rally gives the index some leeway when it comes to consolidating the breakout (and a probable breakout support test). 

Finally... the Russell 2000 delivers a breakout

Image
Today could prove to be a very big day for the markets after the Russell 2000 ($IWM) showed its first sign of life for 2021. The index managed to take out the 'bull trap', and break to a new closing high. Volume climbed to register as accumulation. 

Archive

Show more