Posts

Showing posts matching the search for etoro

Friday's Bounces Ease Back a Little

Image
There was no real surprise to see the gains from Friday come back a little as Thursday's lows play a siren song. The most likely outcome is a consolidation pennant as prices focus off last week's lows - this might take a week to play out but the surge in volatility may see some pushback to stabilize price action. The S&P finished just below 200-day MA as it inches back to 2,710 lows. I would be looking for more small losses or a neutral doji. The best of the action is the strong relative performance (against Small Caps) which runs contrary to price action itself.

Indices Defend 200-day MAs

Image
Last week's selling had put pressure on markets not seen since 2016 but the run of good form has meant Tech and Large Cap Indices are only now testing 200-day MAs. There was a brief overshoot on Thursday but the week closed more settled. The S&P did well to make it back to its 200-day MA but it complicates the risk:reward which now has a loss of 2,710 as the place for a stop which is well outside most comfort zones. Given that, I would look for some retest of 2,710.

Buy Signals Blown Away

Image
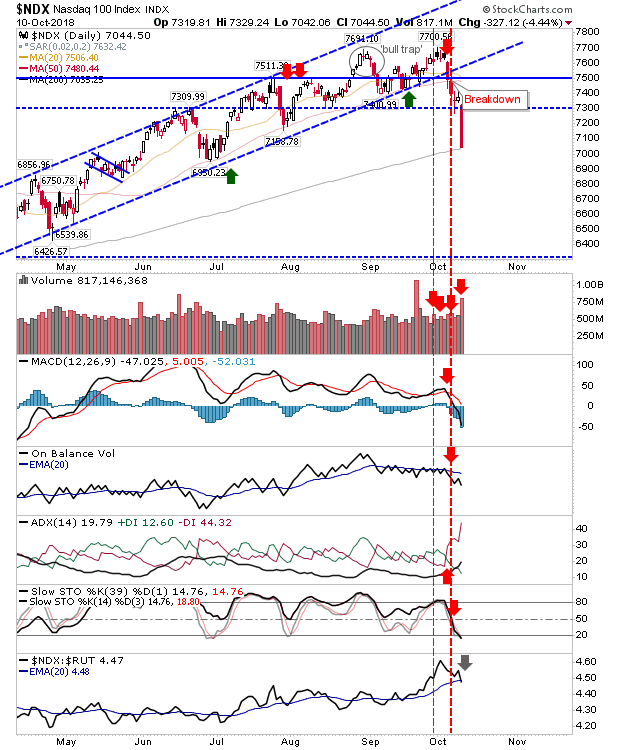
The support levels which were on offer for the Russell 2000, Dow Jones Industrial Average and S&P were undone by the biggest 1-day loss in the year. Not surprisingly, volume rose in distribution as traders bailed.  The only index to finish on support was the Nasdaq 100. Although with a 4%+ loss it would be a brave trader to be buying the 200-day MA.

Buy Small Caps.

Image
Today is a simple call for action. On Friday, the Russell 2000 tagged its 200-day MA in a manner which was picture perfect for those peppering the 200-day MA with GTC 'buy' orders.  Monday was the second chance for a slice of this action with another tag of the 200-day MA. If there is a 200-day MA fail it will be a clean sell but as this is oversold on near-term and intermediate stochastics it's looking like a relatively low risk buy with stops on a loss of 1,615 and an initial target of 1,715 - a healthy risk:reward with the index closing at 1,630.

Russell 2000 Tags 200-day MA; S&P at 50-day MA; Semiconductor Cracks

Image
Indices recorded another set of losses but some now offer an opportunity for longs. Best of these belong to the Russell 2000. The Russell 2000 managed a picture perfect tag of the 200-day MA with Friday's lows making it to 1,618. Shorts trading the tag (of the 200-day MA) will have come out with a nice profit and aggressive longs may have also used the opportunity to trade a bounce with a buy.

Small Caps Take Another Step Down

Image
Small Caps weren't able to recover the channel and another 1%+ loss was chalked up. It's looking ever more likely a tag of the 200-day MA is on the cards. Relative performance actually ticked up despite the loss but this was an ugly day.

Nasdaq breadth metrics breakdown as Russell 2000 cracks

Image
A mixed bag of events for markets as some moved while others remained unchanged. The Russell 2000 made a key move lower as it broke channel support. Relative performance widened its losses as declines were logged.  The next target is the 200-day MA.

Nasdaq 100 ready to breakout? Other indices hanging on.

Image
The Nasdaq 100 is the one index which looks ready to break higher as it pressures the August 'bull trap'. While Friday ranked as higher volume selling - technical distribution - the loss was small and the index continues to push against resistance.  Technicals are mixed with a 'buy' trigger in the MACD offset a weak 'sell' in On-Balance-Volume. The main positive is the surge in relative performance against the Russell 2000.

Markets Weaken with Russell 2000 Leading Lower

Image
That one-day bounce in the Russell 2000 last week is looking like a long time ago as today finished with a cut below its 50-day MA. Technicals are fading fast as relative performance begun a cliff fall. While other indices haven't shown this same level of weakness it's a worrying start as Small Caps typically lead. The slower channel remains intact so it's not a full on reversal yet.

Bearish Evening Star for Dow Jones Index

Image
When I checked the market earlier today it was looking like there was going to be an ugly sell-off but this didn't materialize.  However, there was a bearish evening star in the Dow Jones Industrial Average which may suggest the start of a topping process but while there was some damage to technicals it wasn't enough to suggest this is the top.

Big Picture Unchanged

Image
Expiration volume clouded Friday's selling but there wasn't a whole lot to report on the end-of-week close. Last week's surge in the Dow came to a halt with Friday's doji; a doji at resistance would offer a shorting opportunity but it didn't make it there (channel resistance). Technicals are all positive and aren't showing any negative divergence - another reason to be cautious.  This is a watch-and-wait, a move to channel resistance still looks favored.

Dow Does All The Leg Work; Indices Recover Breakdowns

Image
Solid gains across the board but it was holders of Dow Jones stocks which had the best of the action, continuing a sequence of gains triggered earlier this week.  The Dow Jones Industrial Average will soon be dealing with channel resistance but not until Friday if not early next week. Technials are good. The benefit of this strength was seen elsewhere too

Dow Lead Indices But Recovery Rally Doesn't Reverse All Breakdowns - Chart of the Day Bonus

Image
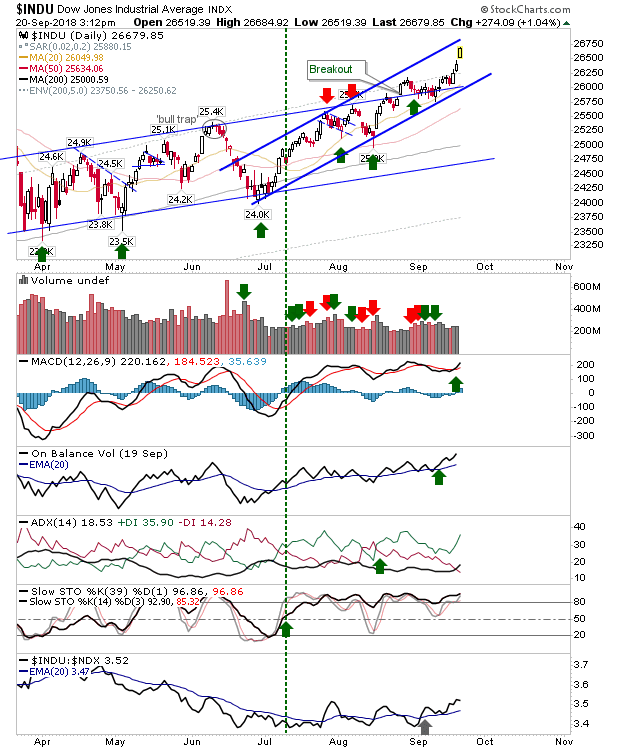
The Dow was the lead index on the day as it marked a new closing high and kept the rally on course to test its accelerated upper channel. Technicals are bullish with the exception of the MACD which is on the verge of a new 'buy' trigger.

Nasdaq and Russell 2000 Looking at 50-day MA Support

Image
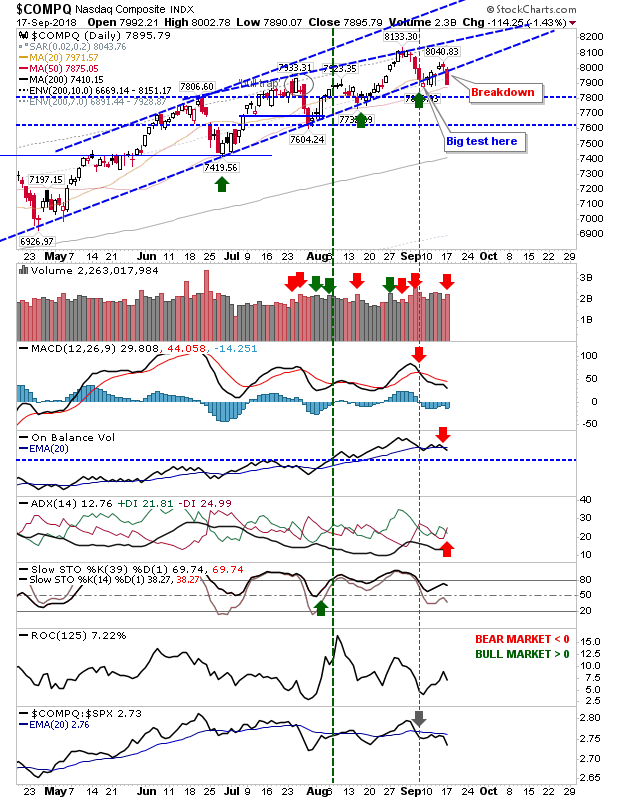
Tech and Small Caps are starting to slip from their summer advances. This may be a simple change in pace but longs for these indices will be looking to 50-day MAs to attract buyers; if these are swept it will leave support lacking until July swing lows and/or 200-day MAs. The Nasdaq fell outside of its rising channel after three prior successes. Volume climbed to register as distribution.

Semiconductors Firm Up a Swing Low

Image
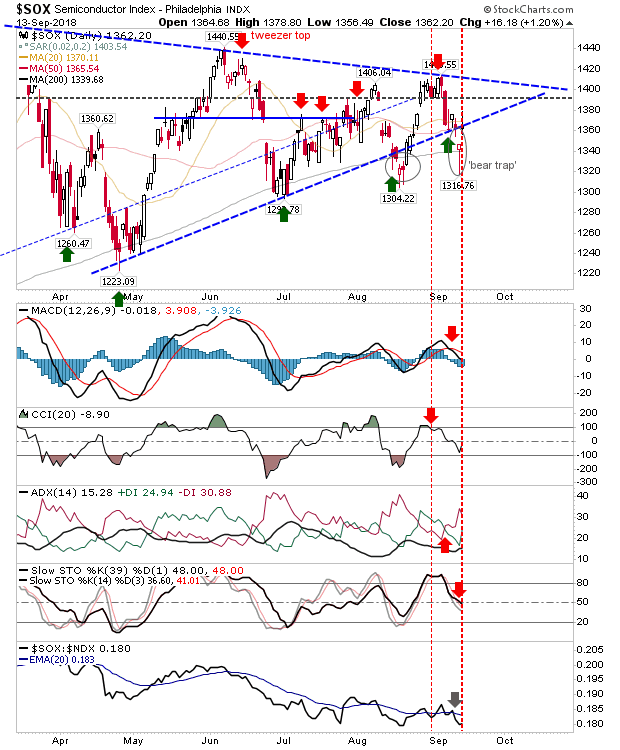
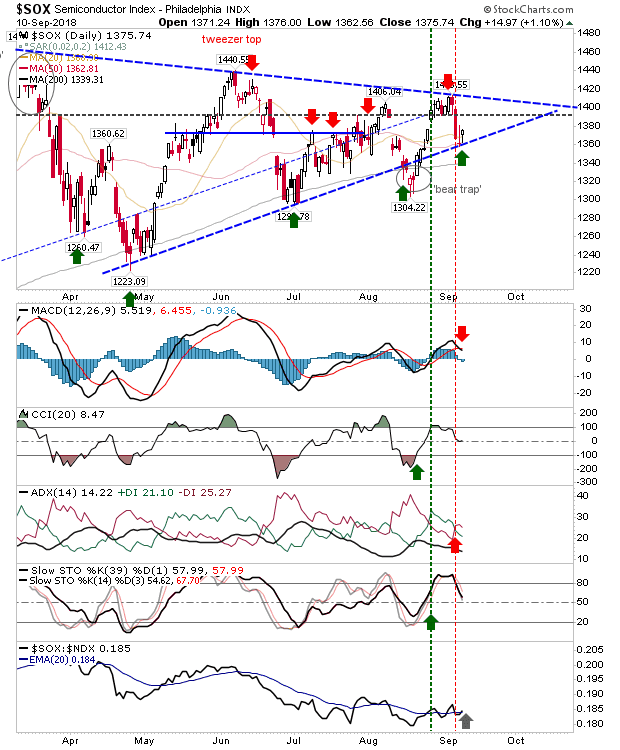
There wasn't a whole lot to Friday's action but two indices which were struggling a little did benefit. The Semiconductor Index gained 1% as it bounced strongly off the bullish 'morning star'. The consolidation triangle looks to be shifting to another pattern but resistance from triangle swing highs remains in effect and is the next challenge of the index.  Technicals are net bearish and relative performance, while recovering, hasn't yet undone the most recent 'sell' trigger.

Russell 2000 Continue to Struggle

Image
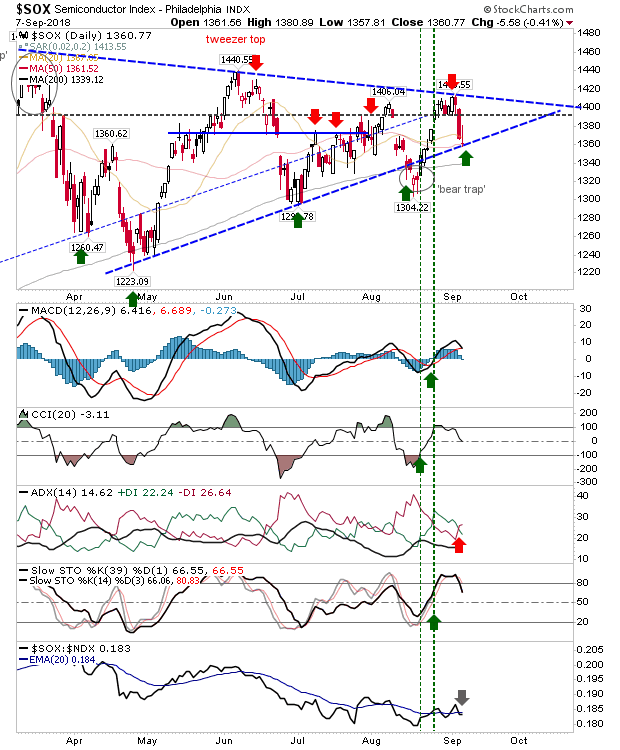
Thursday offered a bright start for markets but the Russell 2000 struggled to enjoy the fruits and by market close things were looking a little more somber. Best of the action belonged to Large Caps but it was Tech indices which started the day brightest. The Semiconductor Index gapped higher and returned inside the consolidation triangle. Had it closed near the day's highs it would have ranked as a bullish 'morning star' candlestick pattern but instead it registers as a 'bear trap'. However, this wasn't enough to stop a net turn in technicals in favour of bears. A loss tomorrow would put the 'bear trap' under threat

Markets Struggle to Rally; What Next?

Image
It has been a tricky last few days. The bounce in the Russell 2000 off the 20-day MA and key support of 1,705 has struggled to follow through on what should have been a strong support test.  Technicals are a bit of a mixed bag with 'sell' triggers in +DI/-DI and MACD. Today's 'doji/hammer' is perhaps the last chance saloon to see something happen here; a lower close Thursday will likely see a break of 1,705.

Semiconductor and Tech Indices Bounce Off Support

Image
Bulls stuck around for another day as triangle support held in the Semiconductor Index along with the Nasdaq. The Semiconductor Index returned above the 20-day MA but it came with MACD trigger 'sell'. Relative strength vs Tech Indices flatlined from July but is attempting a turn higher, albeit quite erratically. 

Nasdaq, Semiconductors and Russell 2000 Hold Support Tests

Image
Thursday's selling had left indices vulnerable to further losses and support breaks, not to mention a weekend of angst but indices held on - ready for a fresh start next week. The Semiconductor Index experienced the greatest loss Friday but the consolidation triangle is approaching its apex and if there is to a break (upside or down) then it's going to have to happen soon or the pattern will trade out flat. Friday did see a successful support test and a buying/short covering opportunity.

Decision Time for Nasdaq

Image
The Nasdaq experienced its second day of losses to bring it back down to 2018 channel support. This looks to be a critical time for the index given the convergence with the 20-day MA. There was a MACD trigger 'sell' and -DI/+DI 'sell' too to compound today's selling. On-Balance-Volume will turn negative tomorrow if there is another down day. From a trade perspective, buying support would look to be the favoured option but given this has come from a failed upside break from the wedge (inside the larger channel) the likelihood for a break lower and a move to test the 200-day MA would perhaps be favoured. Where longs will edge it is if there is a gap lower but a subsequent move back inside the channel.

Archive

Show more