Posts

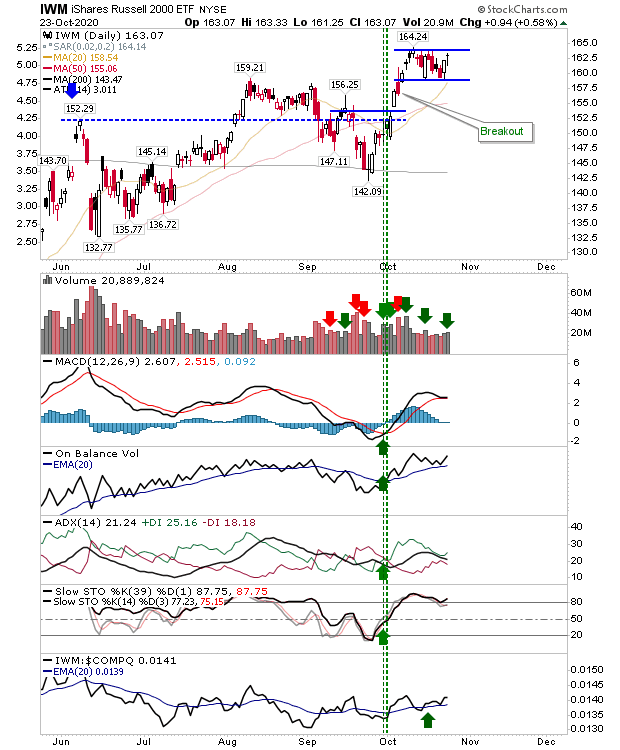
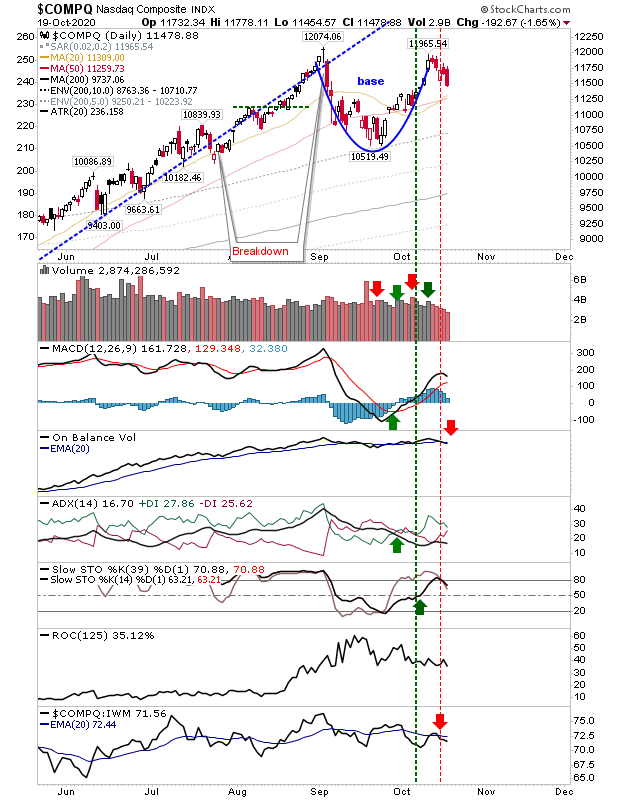
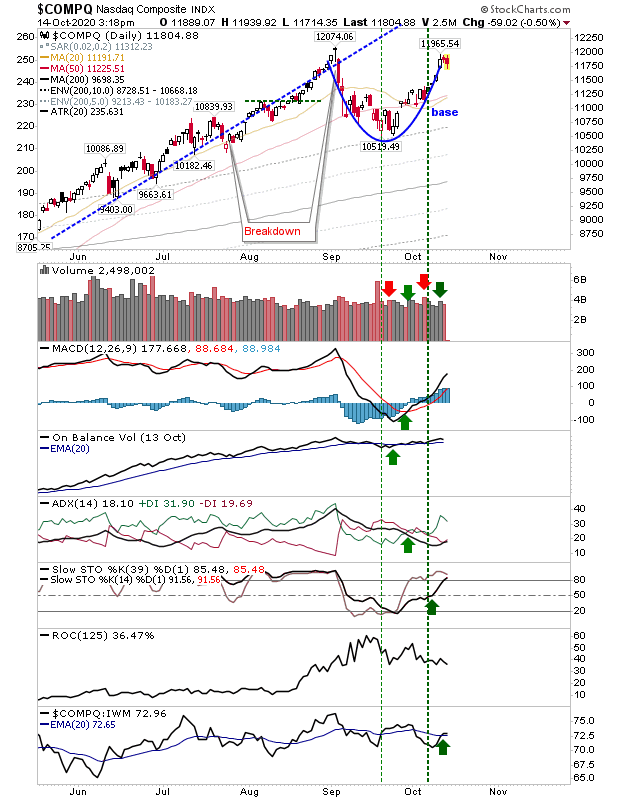
Active Selling Leads To Gap Downs

Image
Media sources blamed increasing Covid19 cases for today's selling but this is hardly news. Up to now, the selling has been consistent but today saw things accelerate to the downside which left difficult breakdown gaps behind.  What this means in broader terms is of instead of looking at a rally continuation we need to look at a broader consolidation.  The Nasdaq is on course to testing the September low but the gap now establishes a break to prior action. In real terms, today's action is not as damaging as headlines might suggest, but we are looking at a shift to a sideways consolidation. Even with that, there is a long way to go before long term support of the 200-day MA is tested - but it's not a buyers market.

The week opens with sellers controlling early action

Image
With the weekend to stew over things, sellers began the week pushing markets below 20-day and 50-day MAs. No index escaped the selling but whatever bullishness was there from Friday was quickly dissipated on Monday's action.   The Nasdaq wasn't the worst hit, but it was enough to expand on the 'sell' trigger in the MACD and bearish crossover in the ADX. The index is underperforming the Russell 2000, which also suffered a loss today. 

Russell 2000 Shapes Bullish Handle

Image
Watching the (Covid19) World Series so will be keeping this post short. The main thing from Friday is the solid bullish handle taking shape in the Russell 2000.  The breakout hasn't occurred yet, but the setup is looking good for the coming week. Technicals are all bullish. A stop would go on a loss of handle support and/or the trailing 20-day MA. 

Selling Pressure Keeps Bulls At Bay

Image
Monday's selling in itself wasn't too damaging, but Tuesday and today's action managed to suppress attempts by buyers to claw back those losses.  With indices finishing near Monday's lows I would now be of the opinion we are going to see further losses.  The biggest worry is the Russell 2000. The bullish handle is still intact, but with today's close right on support I would be looking for this to break tomorrow. On a more positive note, selling volume was light and the index is still managing to outperform both the S&P and Nasdaq. Technicals are approaching a fresh MACD 'sell' trigger.

Selling Accelerates But Volume Remains Light

Image
There was a pick up to Friday's selling, but while the one-day loss approached 2% for the Nasdaq and S&P it wasn't accompanied with the kind of volume such selling can typically scare up.  The concern is that last week's peak for the Nasdaq morphs into a double top, but for this to be true there would need to be an undercut of the September swing low - and that could take well into November. Until then, we are looking at a sideways consolidation. 

Markets develop consolidations off their bases.

Image
This week saw markets challenge September's highs, beginning a process of base formation across indices. Volume fell across the week, fitting with a consolidation and not active selling. This action is bullish for indices - only if selling continues on a pick up of volume should one become concerned.  While Nasdaq selling volume fell over the course of the week, but with four consecutive days of selling the index is close to a 'sell' trigger in On-Balance-Volume. The index is still underperforming relative to the Russell 2000. 

Indices Test September Highs

Image
We started to see a little easing as indices approach September highs. Ideally, we would like to see some sideways action or 'handle' to consolidate gains from the reactive rally off September lows, so if things go quiet here I wouldn't be too concerned.   For the Nasdaq, selling volume eased in contrast to yesterday's higher volume accumulation. Technicals are all net positive, including an uptick in relative performance against Small Caps.  Tech stocks are looking to regain their mojo, which is good news for Tech stock holders looking for new all-time highs.

Archive

Show more