Posts

Market Sentiment: Sector Breadth Divided

Image
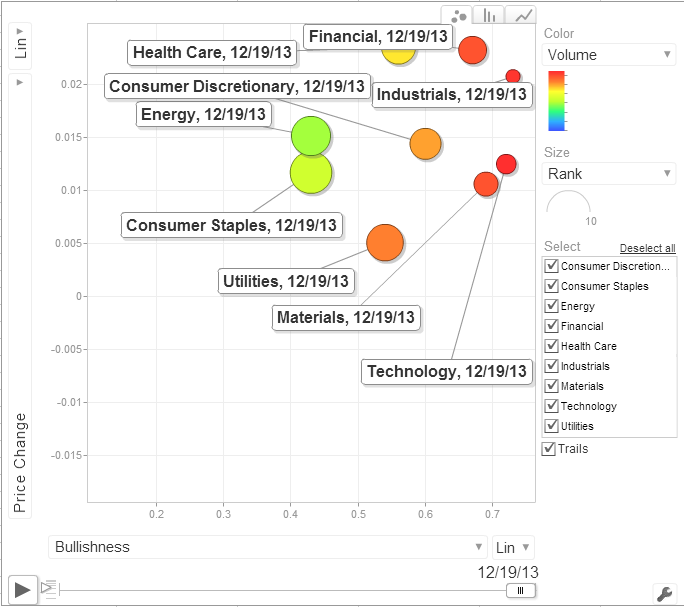
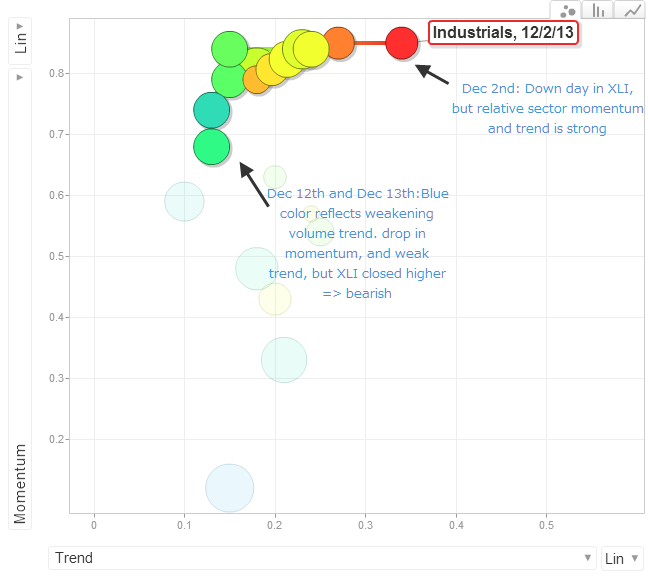
Well, after last week's possible  short suggestion on Industrials , one has to go back to the drawing board. Friday's snapshot covered the prior two days, which offered largest price gains for Financials and Health Care, but it's Industrials which are the most bullish (x-axis), and experiencing the strongest accumulation (red color intensity for volume). The other two sectors showing good volume hot zones on strong bullishness are Technology and Materials.

Daily Market Commentary: Upside Follow Through

Image
Markets got a second wind following improved economic activity.  Volume climbed to the highest since June, no doubt a surprise for those traders expecting a quiet Christmas period.  Better still, it was a good day for Small Caps, which missed out a little on the Fed bonanza. The gain was good enough to reverse the net bearish turn in technicals, and swung relative strength back again in favour of Small Caps; although this has trended against Small Caps since the end of October relative to the Nasdaq.

Daily Market Commentary: The Dust Settles

Image
After Wednesday's turmoil, from breakdowns to breakouts, Thursday proved to be a quiet affair. If - as is likely to happen - the next few days stay quiet, then there could be a low risk long opportunity to take into the early part of 2014. Wednesday's action would have rewarded traders looking at 50-day MAs: to cover shorts, and/or switch long side. The S&P having played to this nicely. Over the next few days, look for a fresh MACD trigger 'buy'

Daily Market Commentary: Semiconductors Going It Alone

Image
In an unusual divergence, the semiconductor index went it alone and is on the verge of a new closing high. This despite losses elsewhere, including small losses in the Nasdaq and Nasdaq 100. The uptick in the semiconductor index should offer help to the Tech indices. There was a relative shift in favour of the semiconductor index against the Nasdaq 100, but a similar move in September eventually petered out. I'm not sure there is enough momentum in the overall market to see this one through, but until proven otherwise, this bull run in semiconductors is to be respected.

Daily Market Commentary: Bulls Fight Back

Image
The easier route was for markets to move lower, undercutting support, but buyers mounted an impressive response to last week's selling, doing so on higher volume accumulation. For the S&P, it looks like the test of the 50-day MA will have to wait a little longer. Although technicals are on course for a net bearish turn, despite Monday's gain. The relative shift to Small Caps, and away from Large Caps continued.

Market Sentiment: Industrials Weakening

Image
I have added a new market sentiment chart with relative momentum, trend and volume metrics in the one chart. As an example in the new chart, industrials (XLI) gained Thursday and Friday, but these gains were delivered with a drop in momentum, cooling volume and a weak bullish trend. The Relative Momentum, Trend and Volume Chart :

Daily Market Commentary: Losses Without Losing

Image
The S&P showed it best: a bright open, which failed to catch, but didn't evolve into losses. The S&P didn't break support and volume dropped. For Monday, it's still a potential bounce play, offering relatively low risk given the presence of support. Those who want to give a long play more room can use the 50-day MA as the marker for a stop - BUT - a break of this support would generate a short play with a stop above 4,018. The one thing a break of support brings is a likely one-day, rapid drop to the 50-day MA, which would leave longs fretting; hoping the 50-day MA sticks as support.

Archive

Show more