Posts

Support Holds Despite Weekend Futures

Image
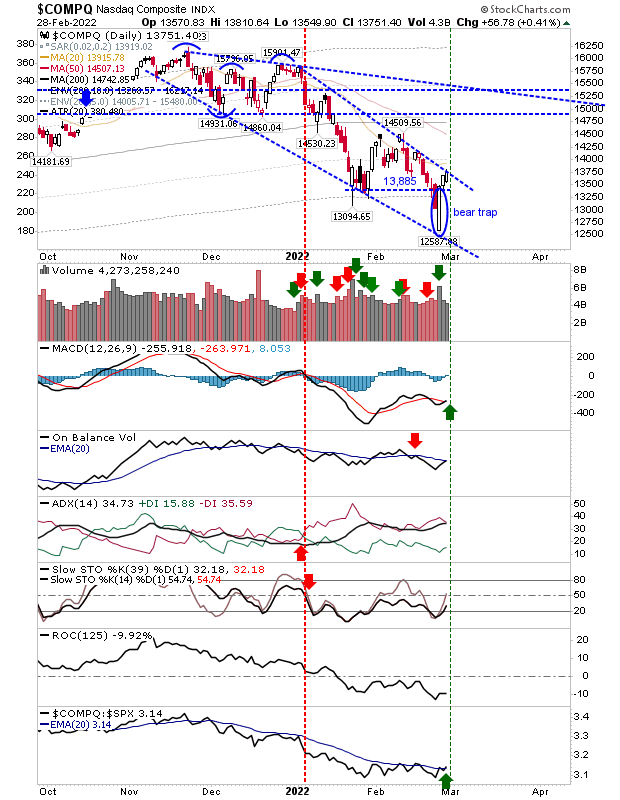
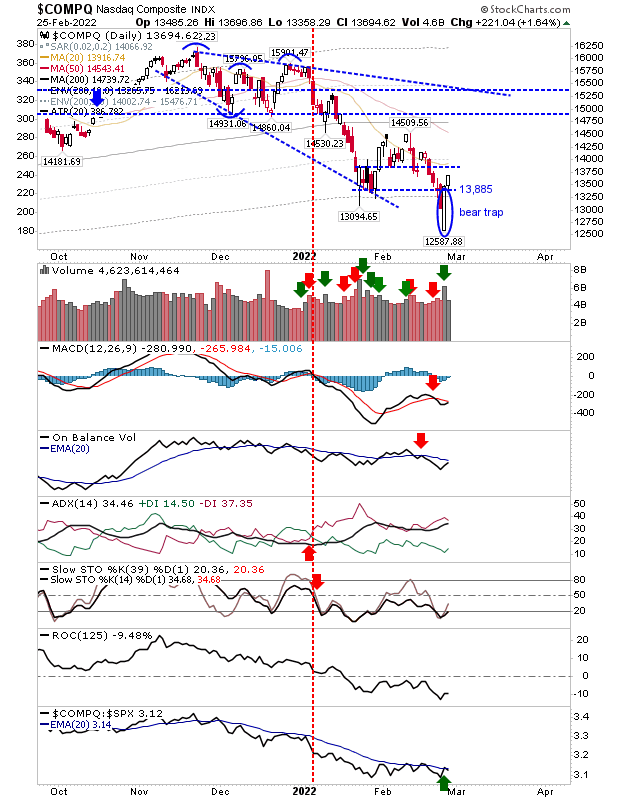
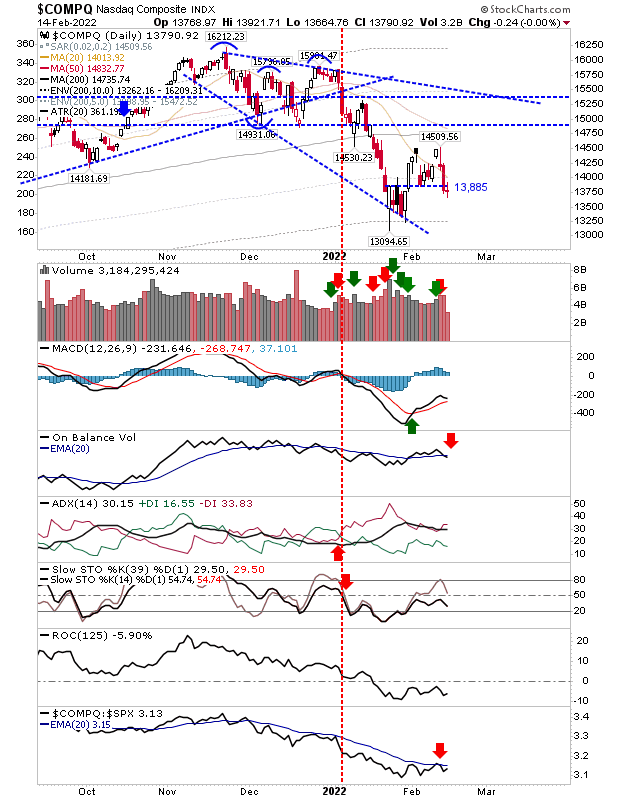
After posting yesterday - then seeing the state of Futures Sunday evening - I thought I was going to be left with egg on my face, but support was well defined on Friday and today's action effectively confirmed these levels as working support.  Of course, we can still go lower from here, but given the economic state of Russia and the war in the Ukraine, today's action was very tepid.  The Nasdaq is about to run into its first piece of price resistance at the 20-day MA, but it does have a 'buy' trigger in its relative performance to the S&P, not to mention a (weak) 'buy' signal in the MACD. 

Bear Traps for Indices

Image
Friday delivered gains which regained real body support across lead indices.  Trading volume was light, but given the gains this wasn't too worrisome.  In the case of the Nasdaq, there was a close above the 20-day MA with a relative gain over the S&P.  The next target is likely to be the 50-day MA (which is currently trading near February highs)

A bottom for the Russell 2000?

Image
War has begun and Covid is near an end; I can only assume traders are 'buying' the war as I would expect the Covid rally to be sold when the virus eventually peters out.  The Russell 2000 ($IWM) looks to offer the best value as the current leg down as suffered none of the heavy volume trading the initial leg down in January experienced.  Today's white candle reversal did register as accumulation for this index - another reason to be positive (unless you live in Ukraine).  Also, with today's low at $187.92 the index is well placed to map a double bottom with the January swing low (with supporting bullish divergences in the MACD and Stochastics).  Technicals are net negative, aside from continued relative gains against peer indices. 

A nervy balance for markets

Image
After Friday's long weekend send off in favor of bears it was a bit of a consolation to see markets turn in a more neutral day.  Today didn't rescue bulls because markets opened with a gap down, but there was no follow through lower - which wasn't great, but didn't damage any support levels either.  The Nasdaq closed on support (defined by candlestick real bodies), with a small spike low which challenged January lows. Technicals are net negative with the index moving further away (relatively) from both the S&P and Russell 2000. 

Two days of selling threatens January lows

Image
The mini support (the clustering of prices at the lows) from January was breached on heavier volume distribution for the Nasdaq and S&P.  The Nasdaq has mostly negative technicals with only the MACD left to turn negative. Friday finished with a 'Death Cross' between 50-day and 200-day MAs which is typically enough to see a larger bearish trend develop. At the very least, a test of 13,095 seems likely and given the higher probability of failure we may be next looking at a measured move down to around 11,500. 

Markets Enjoy Some Stability

Image
We haven't yet a higher low from Monday's action, but today's trading sided more with demand than profit taking. There are small victories to note, even if today's action remains inside the trading range for February.  The Nasdaq effectively paired today's candlestick with yesterday's, adding a relative performance gain over the S&P to an improving MACD and On-Balance-Volume.  Confirmation will require a close above 14,510, but today's action was enough to close the day above 20-day MA.

Trading Action Tightens As Selling Stalls (a little)

Image
There wasn't a whole to today's action - which is probably a good thing.  There was no follow through lower, instead markets traded in a more neutral manner with a set of narrow range doji.  The Nasdaq held on to Friday's lows with a new 'sell' trigger in On-Balance-Volume.  I have marked support at 13,885, but where it's out now is probably enough to consider it close enough to just support; a small gain tomorrow would be enough to regain this support. 

Archive

Show more