Net Bullish Technicals for S&P and Nasdaq
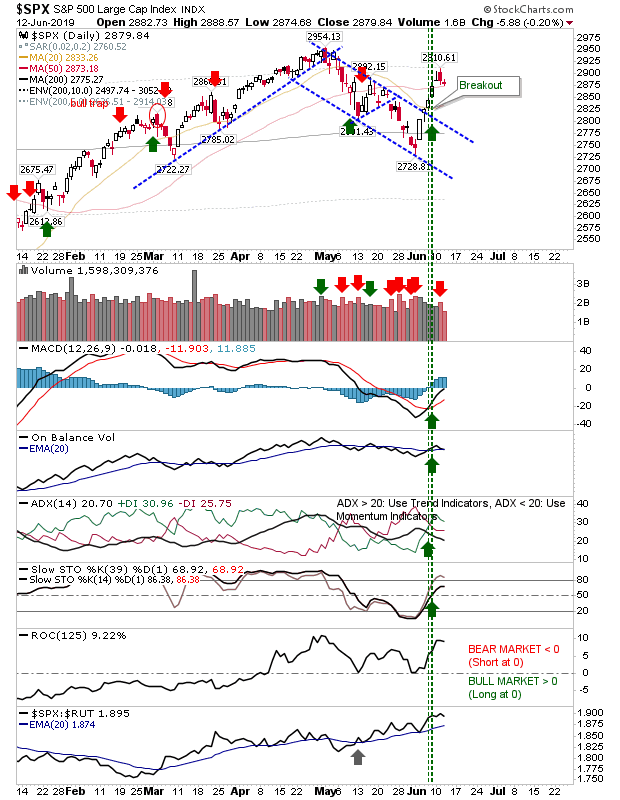
Since the last update we have seen significant technical improvement, even if the indices registered losses over the last couple of days. The S&P is now resting near its 50-day MA but there may not be sufficient wiggle room for it to be held as support. If this was to fail then next would be former channel resistance now support.
The Nasdaq required a sharper recovery to make it to its 50-day MA, but now that it's there it finds itself struggling to hold it. I have drawn in Fib retracements which may provide a more reliable price zone for a bounce.
While the Russell 2000 has struggled against the Nasdaq in recent days, the last few have seen the Russell 2000 do well to hold its gains and the 20-day MA. The index still has a relative under-performance against the Nasdaq to work out and this week has seen a typically bearish 'tweezer top', but today's doji on 20-day MA support mitigates that a little and the index is nicely placed for another surge.
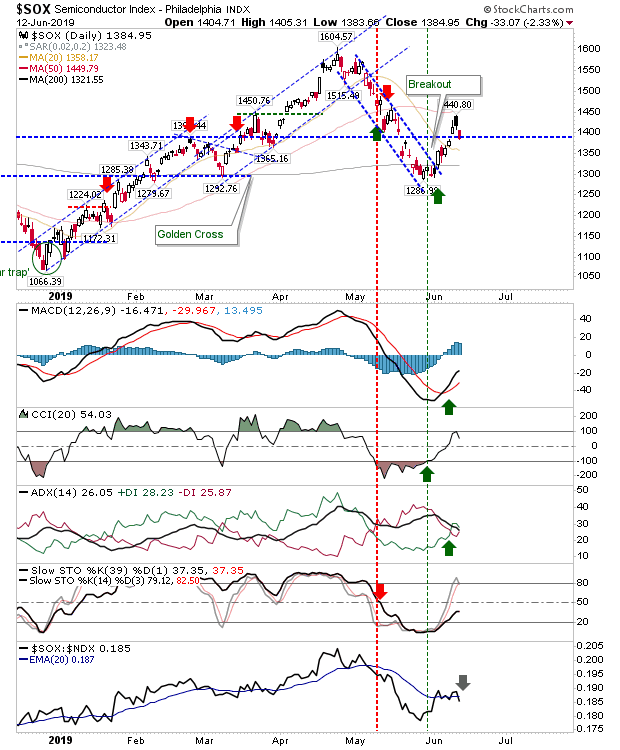
The Semiconductor Index has come back to a former major resistance level, now minor support. After recovering from the dip below the 200-day MA I would be looking for any decline to now use this 200-day MA as support.
The last few weeks have seen an end of the decline and the start of the next bounce. The question now is whether indices have finished their bounce. Longs hold the advantage but I would like to see some additional tight
You've now read my opinion, next read Douglas' blog.

---
Accepting KIVA gift certificates to help support the work on this blog. All certificates gifted are converted into loans for those who need the help more.
Follow Me on Twitter


Investments are held in a pension fund on a buy-and-hold strategy.
The Nasdaq required a sharper recovery to make it to its 50-day MA, but now that it's there it finds itself struggling to hold it. I have drawn in Fib retracements which may provide a more reliable price zone for a bounce.
While the Russell 2000 has struggled against the Nasdaq in recent days, the last few have seen the Russell 2000 do well to hold its gains and the 20-day MA. The index still has a relative under-performance against the Nasdaq to work out and this week has seen a typically bearish 'tweezer top', but today's doji on 20-day MA support mitigates that a little and the index is nicely placed for another surge.
The Semiconductor Index has come back to a former major resistance level, now minor support. After recovering from the dip below the 200-day MA I would be looking for any decline to now use this 200-day MA as support.
The last few weeks have seen an end of the decline and the start of the next bounce. The question now is whether indices have finished their bounce. Longs hold the advantage but I would like to see some additional tight
You've now read my opinion, next read Douglas' blog.
---
Accepting KIVA gift certificates to help support the work on this blog. All certificates gifted are converted into loans for those who need the help more.
Follow Me on Twitter
Investments are held in a pension fund on a buy-and-hold strategy.


