A torid week for bulls (unless your Spanish!). What did the Stockcharters see in it all?
Maurice Walker has his weekend summary up on his public Stockchart list. He notes the decline in PCE inflation for the year. I would disagree with his analysis we are not in a bear market; this is a secular bear market which kicked off in 2000, with a cyclical bear market from Oct 07 based on action of breadth indicators. As a sidenote, Ireland is in offical recession with the latest GDP at -1.5%; given the strong business relationship with the U.S. it may have some relevance (or it may not - but given Intel, Dell etc have their European bases in Ireland it's not good news). But here is his opinion because it's (always) worth reading:
Sorry for posting so late in the weekend but I was feeling ill, and no, not because of the market. We have done very nicely in our short positions taken on May 20, along with the swing trades made back and forth along the way. This week we found out that inflation actually went down in spite of record high oil prices. Yes its true, the rate of inflation measured by the PCE index declined for the month of May. The all inclusive price index for Personal Consumption Expenditures (PCE) has been steadily decreasing since January. Each month since the beginning of the year has decreased from the prior month, the year over year PCE inflation rate has been steadily declining. I hope your sitting down because here are the figures. I doubt the media will tell you this but inflation has declined each month during 2008. You can see the figures at my site by clicking onto the PCE inflation report.
Year over Year PCE inflation for 2008:
Jan 3.5
Feb 3.4
March 3.3
April 3.2
May 3.1
Contrary to popular believe, inflation is declining not rising. Inflation was higher than it is today in 2007 and it was even higher in 2006. That is because the economy is growing below trend at just 0.80 %, and the consumers purchasing power has been stripped away by high energy prices, thus containing the forces of demand-push inflation.
Now in spite of higher oil prices rising by over 100 % in the past year, core PCE inflation has not been effected. Those that told us that high energy prices would spill over into core inflation were wrong. Core inflation is at just 2.1 % and hasn't had the huge percentage gain that oil has.
Now ABC news reported that high oil prices are prompting investors to move their money out of the stock market. I beg to differ, I think ABC news and the media are prompting investors to move their money out of the stock market due to fear-mongering. There are people who are just dying to get bad news about this economy.
This past week we did find out that more write-downs are coming. Not only that, but Citigroup and GM got downgraded. Oracle and Research In Motion had lackluster earnings reports that suggests the future may not be so bright for those companies.
Now the DJIA declined by 4.19 %, the S&P 500 fell by 3.0 % and the Nasdaq dropped 3.76 % percent for the week. The DJIA is at two year lows, resting on key rising support from 2004 on the weekly chart. The DJIA is down 19.9 % from its 14,164 all-time high, while the S&P 500 is down 18.3 % from its all-time closing high of 1565. Should the Dow close below 11,331, it will be in bear market territory. I am one of the few that doesn't believe that the market will move into a bear market. One reason for this is I think that the S&P 500 is carving out a huge cup with a handle pattern on the weekly chart. I believe that we are forming the handle at this time.
I think that the market looks forward and discounts the future. I believe that it has already priced in the housing recession, credit crisis, the write-downs, and the slow economic growth reflected in the latest GDP data. By the way, I don't think we will even get a negative qaurter of GDP in 2008. Now we could slip into a bear market, but so far there has been absolutely zero evidence that, that will be the case. And if my technical indicators reveal that the stock market is in a bear, I will happily concede. I don't care which way the market moves, because I will trade in the direction of the trend. But for those you betting on a bear market right now, I will continue to take the other side of that wager.
The index weekly charts are resting at their 38.2 % Fib levels and I believe that they will find support there. If they do a beautiful channel will be in place (see the second chart down).
The bears told us during the August lows to get out of Dodge. But prices had a nice run from August to October. Then the bears were wrong during the January lows, when they told us it was all over and that we were insane to buy the January lows. Which had a nice percentage bounce for us traders. And then there was a fine test of those January lows during March. And the bears told us we were crazy to buy during the March lows. But had you listened to the bears, you would have missed a 15 % run up on the S&P 500 in just two months from March to May (intraday low to high). They were wrong during the August lows, they were wrong during January lows, they were wrong during the March lows and I think they are wrong now. The bears having been telling us every since 2004 that the bull market is over, and they have been unsuccessful in writing it's obituary.
Is the cup half empty or half full? I think it is half full and I am looking for the interest rate cuts to ultimately kick in. We have already seen evidence that the stimulus package is working in the consumer spending data and then this past week in the personal spending figures showed an increase of 0.8 % in personal spending. The bulk of the rate cuts were done in the early part of 2008 starting in January. And those were the larger cuts, so I would expect to see improving signs 6 to 8 months down the road from the beginning of 2008. That means we may start witnessing the effects of those cuts this summer.
I am looking for a candlestick reversal pattern. The DJIA and S&P 500 look like they might be setting up a Morning Star reversal. If that is the case, Monday will be the third day of the pattern with a long white candlestick closing into the middle body of the first day's candle (Thursdays candle). Sometimes prices exceed the high peak of the first candlestick. Whether this pattern is going to be a reversal, only time will tell. But I am watching for a reversal.
Additionally, I will continue to look for capitulation. One problem with a bottom at this level is that we haven't seen the put/call ratio spike to 1.50 yet marking capitulation. I will keep you informed regarding a reversal. I have taken positions on SSO and DDM. But again, you should wait for confirmation of a reversal. I have made a lot of profits in which I have a higher risk tolerance right now than most. But should we slip into a bear market I will be forced to close my position at a loss. If my position is correct, I will add to it accordingly. I believe that the market we find support and then move sideways.
I am still short the QQQQ via QID and the smallcaps via IWM. Because they lagged, while the other averages tanked. They still might meet their targets. I am still short the Transports via IYT and basic materials. I am still holding my short on USO, using a mental stop. I want to see evidence that it continues to close higher rather than intraday spike highs. The current candlestick is a shooting star that could produce an evening star reversal if USO moves lower tomorrow in a big way. If you use mental stops, watch prices like a hawk. But if you cannot monitor an ETF or Stock use stops. I usually do, but crude has been very volatile and I want to see prices close in strength before I cover. So far I haven't seen strength but intraday weakness in the form of reversals.
The bears can shout recession and bear market rally all they want. But until we get any evidence of a bear market it is just speculation on their part. And that is all it is! It is only those with cool heads that will make money in this market trading the trends. So far we have done that! I think the bears are way to premature in doing the unity dance. Personally, I think this market is going to catch a lot of people of gaurd when it rebounds. thechartpatterntrader.com
thechartpatterntrader.com
Dr. Joe is considering a Bear market in effect:
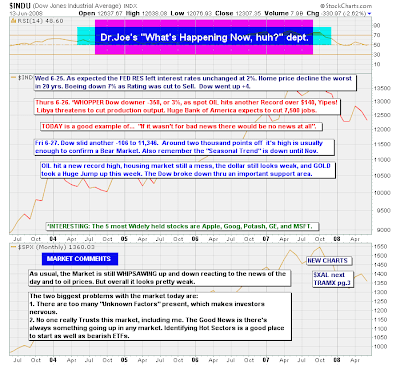
Wow! I hadn't realised Airlines had it so bad; might be worth dollar cost averaging to save having to nail a bottom:

Joe notes the triple band of support broken in Dow:

Yong Pan still has a predominately red screen summary with two new bear signals to one new bull signal:

Recommends some short covering in the SPY:

Like myself he thinks events in the Dow will repeat for other indices:

I like his Black/Yellow indicator overlays on the following chart:

Richard Lehman is looking for short term bounces, but is finding upper trendline resistance hard to define:
6/28 -- I had to make the lower short term channel lines even steeper on almost everything to show the trend's acceleration downward.That leaves the upper lines less 'clean' since they mostly have only a single point, but that's what the trend is saying. The RUT has the cleanest channels all around -- and that index came right down and touched the lower line without needing any adjustments at all. We should get a bounce within trend here very soon, but the long term picture shows a lot of channel space below us to potentially fill.
6/26 -- Bad karma today, but some very positive chart magic!! The Dow stopped dead on its lower short term trend line. So did SPX. After drawing the slope change that really began days ago, so did the small caps. Look at it now and we're at a nice potential bottom (at least for now)across the board. Relentless selling was needed to bring things down to a support point. Yes we broke 1300 on the S&P and that probably caused some selling, but the REAL support line is right where it closed! Institutions also needed to lighten up for the end of the quarter and midyear reports coming up. Interesting how the Dow put in a new low for '08 while the SPX did not and the small caps are way above. Cynical question of the day: Where was Goldman's research analyst to downgrade Citi when it was 50, or 40, or even 25????? Now at 18!!!! How much does he get paid for that kind of crap??????????
6/25 -- Even with the late sell-off, we do have mini short term uptrends, though of course the Dow was the worst performer since I was long the DIA :( But it doesn't look like anything other than counter trend rallies to me so far, so if you're long, don't stay too long.
Finally, Jack Chan has a clean Trend-line break Sell signal for the Energy Select SPDR (XLE):

Dr. Declan Fallon, Senior Market Technician, Zignals.com the free stock alerts, market alerts and stock charts website


