Oil took the headlines by the close of the week. Did the Stockcharters have anything to add?
Dr. Joe noted the GM closures, and of course the gain in oil prices.
But one cannot like the false breakout in Exxon; this is a bull trap and would be bad for oil prices (but good for the consumer):

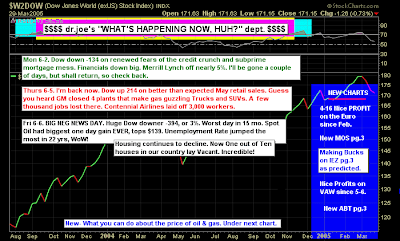
Joe's Dow chart doesn't spell much fun for the near future:

Maurice Walker sees deception:
Investors retreated from the stock market this week, because the future state of the economy appears to be somewhat ambiguous. The bad news bears were out playing on peoples fears, as they are once again are attempting to create the illusion of a recession. These prophets of doom and gloom are once again prophesying an economic tsunami. The financial media is deliberately intending to mislead the public of the facts, purposely avoiding clarity and creating a paradigm of fear. And fear can motivate you to action, but it can also paralyze people, and that is exactly what we witnessed during Friday's mass hysteria.
According to the bears, the economy has hit an ice burg, and they are already boarding the life boats on the Titanic. A rising unemployment rate and rising crude oil prices struck a deadly combination blow to the stock market on Friday. Speculative trading drove crude oil futures up over $10 a barrel on Friday, which is the largest one day gain in its history, causing crude to close at a record high of $138 a barrel. Morgan Stanley announced that they are predicting crude oil to rise to $150 a barrel by the July 4th holiday, due to falling US inventories. Additionally, tensions are rising between Israel and Iran. Israel's transport minister remarked that an attack on Iran's nuclear sites appears to be 'unavoidable.'
The non farm payrolls revealed that job losses in May increase by -49 K, and April's losses were revised upward by an additional -8 K losses. That makes a total of -57 K bringing the total lost jobs for the year to -324,000. Unemployment increased by 861,000 people bringing the a grand total of the unemployed to 8.5 million. That caused the unemployment rate to jump by 0.5 %, rising to 5.5 % which is the largest one-month increase since 1986. A year ago, the number of the unemployed stood at 6.9 million, while the unemployment rate was just 4.5 percent.
Most Americans have bought into the idea that the economy is in a recession based on the overall pessimism and anxiety. They see their net worth is shrinking, and their purchasing power declining due to high energy and food prices, causing them to buy into that line of thinking. This week it was reported that household wealth declined in the first quarter by 2.9 %. I know events are very fluid here, and there is still a lot of confusion about the soundness of the US economy. But this unchallenged assertion that the US is in a recession is just poppycock. Those who continue to claim that the US is going into recession will likely attempt to save face by changing the academic and historic definition of a recession. I expect that these broad definitions of recession will start surfacing by the end of the year, once the recession crowd realizes that they won't be able to get two negative quarters of GDP.
The current economic slowdown is all part of the natural economic cycle. Last Monday, I informed you that I expected the unemployment rate to rise and hover near 5.5 %. I am not shocked by this report, because the economy is only growing at three-quarters of one percent annualized. The unemployment rate is an indicator that looks backwards not forwards.
The non farm payrolls came in bettern than expected at -49 K rather than the estimated -60 K. I still have seen no proof of millions of job losses that accompany a recession. We have only lost a few hundred thousand. I would anticipate the job market will grow towards the end of the year once the economy starts picking up again. Furthermore, retail sales for May exceeded expectations, which means that the rebate checks are having an impact. Once again, the chances of a recession are slim to none, and slim has left the building. The most expensive commodity right now isn't crude oil, it's ignorance.
We have been short this market since the day after the May highs occurred on the DJIA and the S&P 500. For those of us who remain calm and don't buy into all the rhetoric, we can continue to play the short side, as the obsession recession crowd continue to scare investors. But when capitulation finally sets in, we'll find some long entry points at a very attractive prices.
On Thursday, crude oil bounced off its rising trendline and produced a bullish triple P pattern (P-p-P) along with other positive signals. The DJIA continues to breakdown from a double top pattern. The QQQQ still have a double top pattern in play. The S&P 500 appear to have broke down from a head and shoulders top.
Rather than worrying about the threat of recession, we really ought to be concerned that congress just passed a $3.1 trilion budget this week, that has a $394 billion deficit for 2008. That will add $394 billion to the already balloned 9.5 trillion dollar national dept. They estimate addition deficits of $340 billion in 2009 and $210 billion in 2010. Our politicians continue to be out of touch with reality, and our leaving an enourmous bill for our grandchildren.
I would like to acknowledge the 64th anniversary of D-day. And thank those who participated in the invasion of Normandy, saving the world from fascism. To those fallen heroes we offer you an eternal debt of gratitude, for having the courage and the wherewithal to stand up to the evil that threatened the world. You truly are the greatest generation! thechartpatterntrader.com
Maurice's Q's chart is on an important test of support:

with a potential ascending triangle:

and Fib support for the Dow:

Yong Pan has a shortened summary, but it is mostly in the red:

Sees Dow (negative) leadership in the market - looking for other indices to follow its lead:

I really like this chart of the QQQQ:SPY

And the complex head-and-shoulder pattern in the SPX:

Richard Lehman sees vestiges of support for small caps and tech:
6/6 -- Not a fun day, but some channel magic did occur. The Dow and SPX both slightly overshot their purple channels, which means those channels could be steeper than drawn so far. I put alternate lines on the hourlies of both indexes to show that possibility.
The magic occurred on the Naz. The index closed right on the lower line of an upchannel that didn't appear until the last peak was in. When an index makes a precision landing on a channel support line in a day where everything else is breaking, that's impressive. The QQQQ and the RUT came close to a similar line as well. The good news is the small caps held support in a well defined short term upchannel.
Of course, there's always Monday :(
6/5 -- Heck of a nice bounce for the Dow off its lower ST support line, but the overall trend on the Dow hourly is still down. Same for SPX though less steep. The SPX hourly actually has a clear pattern of breaking a green line to the downside weeks ago and coming back up for a perfect retest, but then heading lower again. And even today's rise doesn't change that picture.
Its the small caps that are on a tear and actually in uptrends. The QQQQ (aided by oil stocks) has now recovered about two-thirds of the entire drop from last November. But those uptrends are goiing to be approaching upper channel lines before long here. I'm really wondering how long the small caps can continue rising at the current rate.
6/4 -- FINALLY IN THE HOF!!!! IT ONLY TOOK 3+ YEARS!!!
THANKS TO EVERYONE FOR YOUR VOTES AND FEEDBACK.
Finally, I will show two charts of Jack Chan's; which one do you prefer?

Or

Dr. Declan Fallon, Senior Market Technician, Zignals.com the free stock alerts, market alerts and stock charts website


