Posts

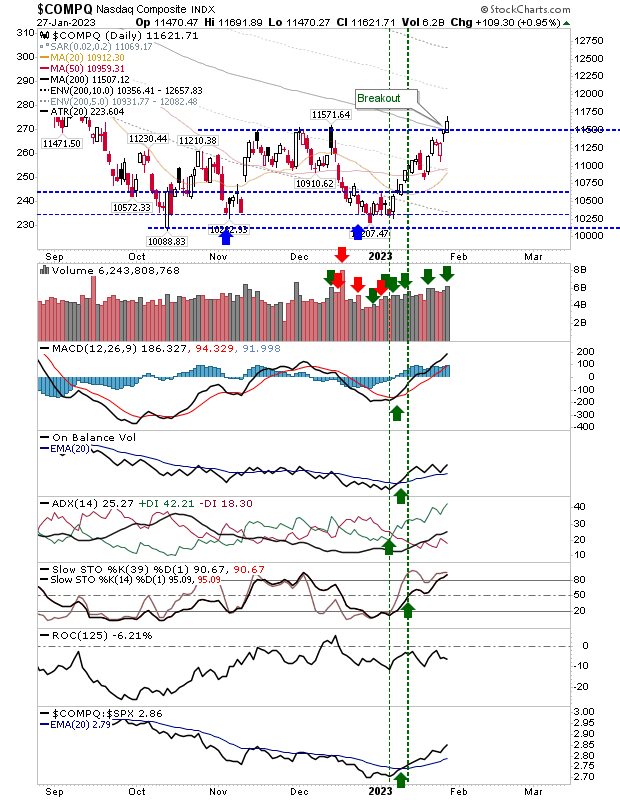
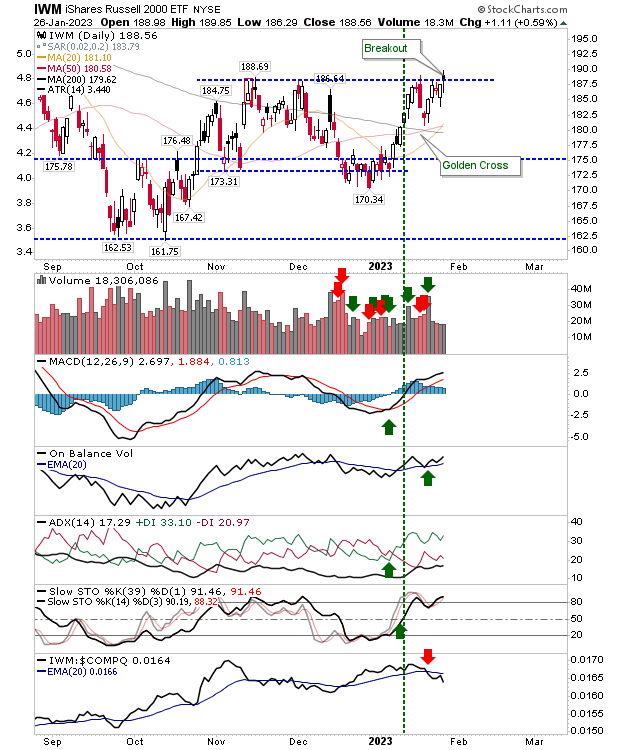
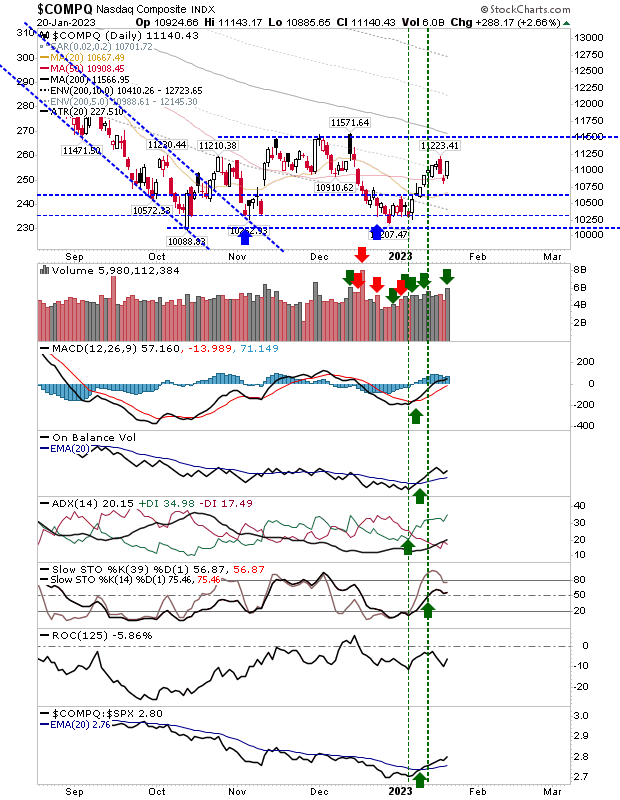
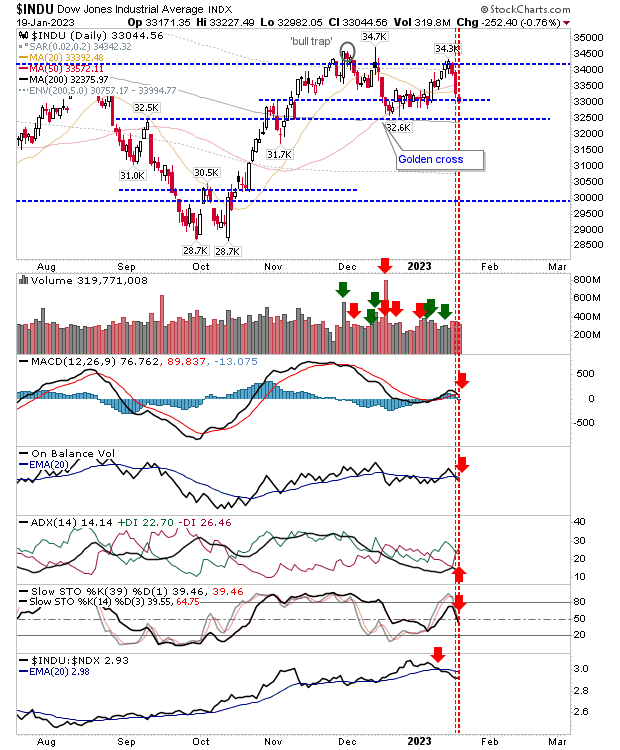
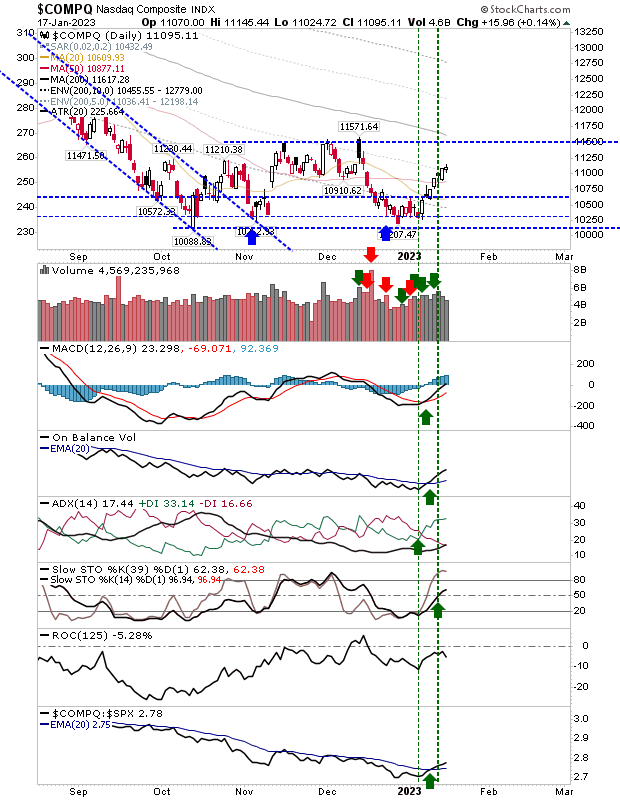
'Bull traps' threaten Nasdaq and Russell 2000

Image
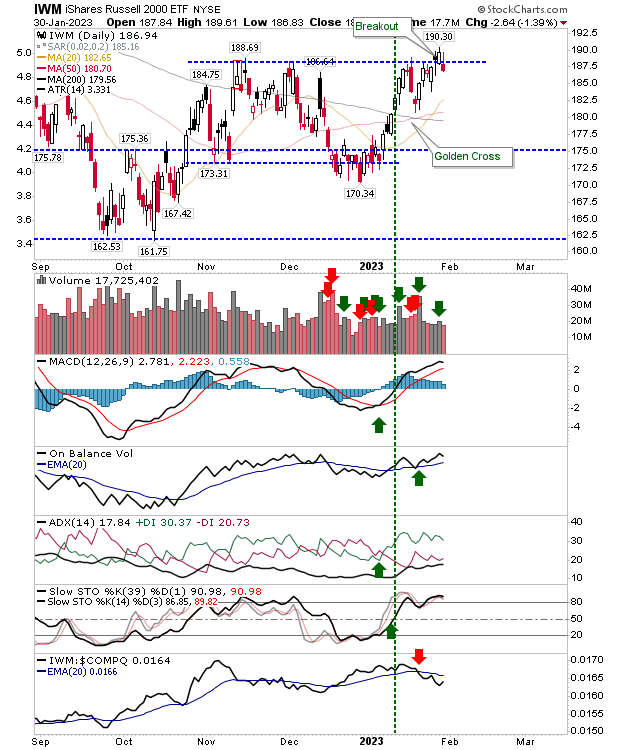
What goes up may come down, or at least, the nascent breakouts in the Nasdaq and Russell 2000 now find themselves on the wrong side of support. It hasn't been a total collapse, selling volume was down on Friday's buying, and the potential for a recovery is quite high.  But for this to happen, sellers can't be allowed to build up any momentum.  As things stand, the Nasdaq and Russell 2000 now find themselves back inside the prior consolidation. The Russell 2000 is underpeforming the Nasdaq, so it's the most vulnerable to further selling.  Even if the 'bull trap' is confirmed, I would still look for the potential of the 20-day MA to play as support.

Nasdaq Breakout

Image
Friday was a clear victory for the Nasdaq with a breakout to go along with higher volume accumulation and a close above the 200-day MA.  Nasdaq technicals retained their net positivity and it will take a sharp loss Monday or Tuesday to undo this positivity.  Step-by-step, this nascent cyclical bull market grows in strength.

Russell 2000 breakout?

Image
I'm not entirely convinced by the Russell 2000 resistance break, primarily because it has triggered on a 'black' candlestick, typically a bearish candlestick.  Volume wasn't great, but there is a significant 'golden cross' between 50-day and 200-day MAs that should bring some bullish momentum with it.  Technicals are good, but there is the relative undperformance against the Nasdaq.  Let's see what tomorrow brings. 

Buyers build momentum towards resistance challenges

Image
A positive Monday built on the buying of Friday, and today's potential to return those gains was repelled.  There was decent volume to the buying, and more modest volume to today's low key selling.  It's safe to say we have a swing low established from the end of December, and a workable rally - all part of a larger basing pattern kicked off from October.  One index I haven't mentioned in a while, but posting strong gains over the last couple of days, is the Semiconductor Index.  In addition to clearing the bearish 'black' candlestick from December, it has also pushed beyond its 200-day MA with an acceleration in its outperformance against the Nasdaq 100. I view the latter relationship as the tech equivalent of the Dow Theory, and an outperformance for semiconductors is bullish for the broader tech sector. 

End of week gloss marks strong accumulation finish for indices

Image
It was an earlier then expected - but welcome - rally which closed the week out. Indices exhibiting bullish technicals are looking in good shape, even if it's a bit of a slow burn. The Nasdaq has yet to challenge the December highs, nor its 200-day MA, but the index is accelerating its relative outperformance to the S&P, with on-balance-volume trending higher.  Buying volume registered as accumulation and while it hasn't knocked out last week's swing high, it should do so this week and build on a challenge of 11,500.

Sellers attack as moving averages come to the rescue

Image
The real selling was yesterday but there was sufficient demand to keep things flat for today.  Hardest hit was the Dow Jones Industrial Average as it pushed below the 50-day MA and back into December's congestion.  Technicals are net bearish, which adds to the selling pressure in the index.  I would be looking for a test of the 200-day MA this week - a moving average currently running along horizontal support of the September swing high and the December swing low. 

A tick in the calendar as today's non-event keeps markets on track for breakouts

Image
A pause in the Santa rally keeps things on track without confirming anything.  The Nasdaq had the best of the action by virtue of its modest close higher, but really, there wasn't much in it for any of the indices.  Volume was below Friday's, so no registered accumulation day, but it did at least add to the bullish trend in On-Balance-Volume.

Archive

Show more