Posts

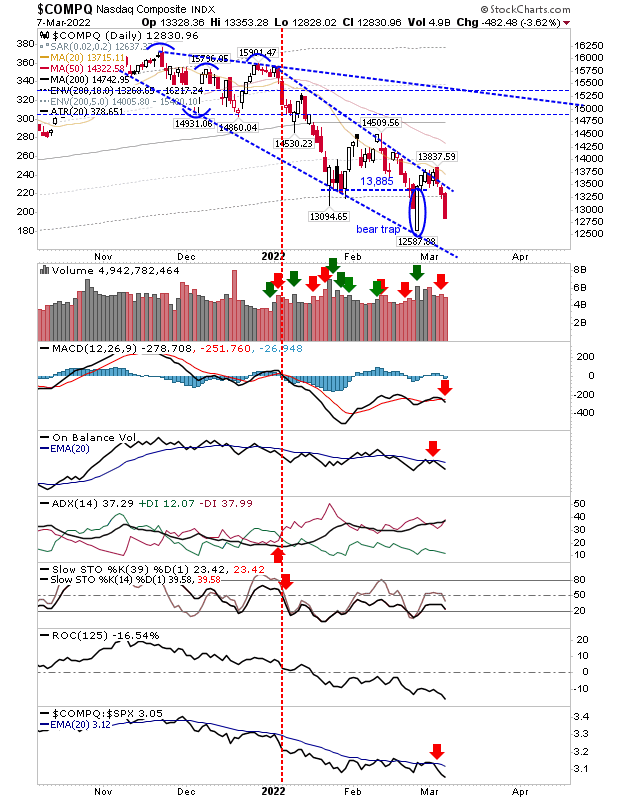
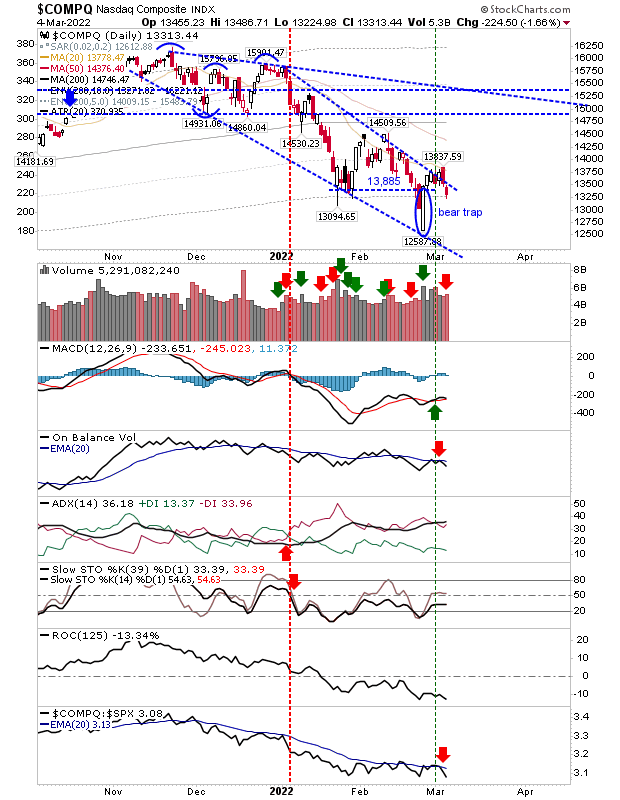
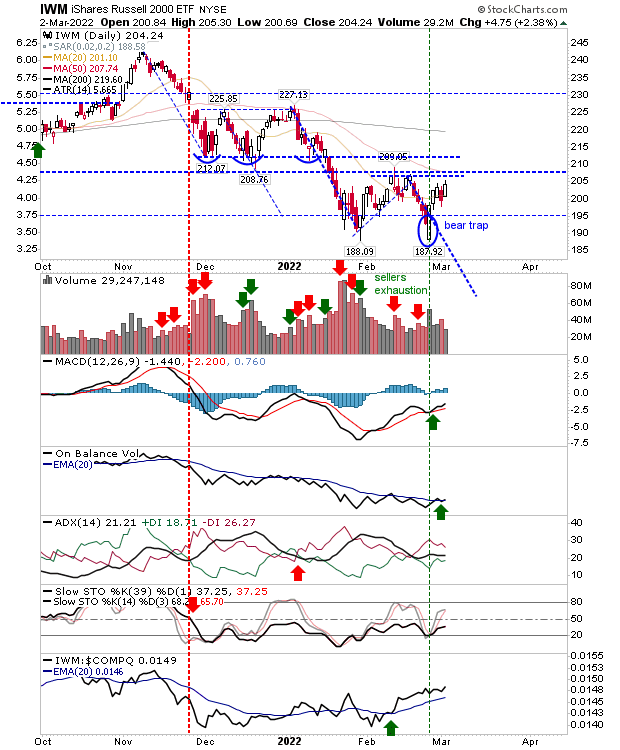
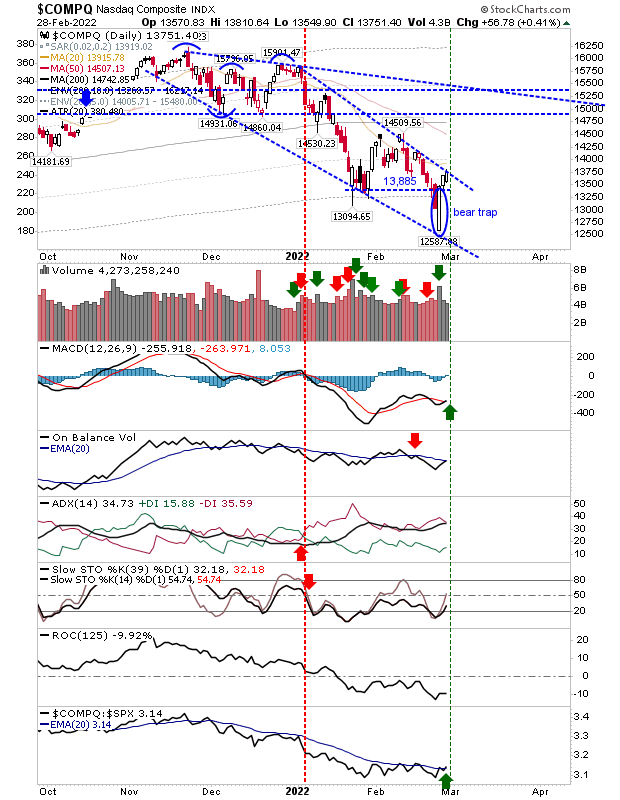
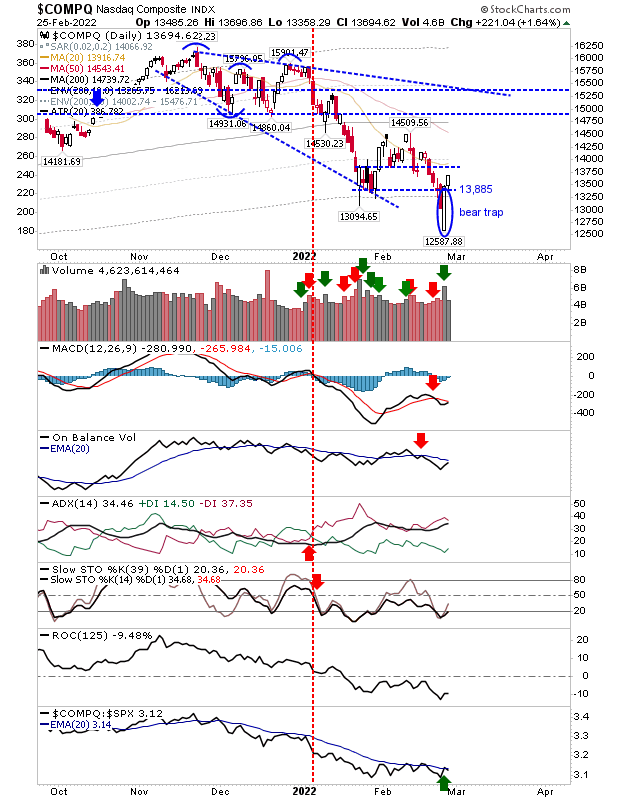
Bullish reversals, but markets not out of the woods.

Image
Just as the selling meant indices were not as weak as headlines suggested. Likewise, today's buying was not as good as the media would suggest either. However, it did at least stall the break of the most recent swing low. The Nasdaq has made its way back to declining resistance of the slow forming wedge, but technicals are all bearish and it remains some way from a bullish 'buy' in relative performance to peer indices.

Not strong enough...

Image
So the market has spoken and the selling continues. Whatever defense traders were able to mount on Friday was swiftly taken out on Monday.  However, the Russell 2000 again came out looking the best. Hardest hit was the Nasdaq as it lost 3.6% in a clear push into the large white candlestick marking the Feburary swing low reversal.  Today's selling came with a return 'sell' trigger in the MACD to go with existing 'sell' triggers in other technicals.  Relative performance took a large tick lower.  The only salvation for bulls was the lower volume; despite the big price loss there was no confirmed distribution. 

Now, we will see how strong the late February reversal is

Image
After the big surge off February lows on higher volume accumulation.  Now, we will see how robust such demand is with markets edging back towards February lows.  The Nasdaq is looking the most vulnerable as it has already cut below support which defined the 'bear trap'.  The breach was relatively minor from a price perspective, but it did come with a higher volume distribution and a 'sell' trigger in On-Balance-Volume.  Relative performance took a sharp tick lower. Again it's early days and the bullish reversal is not immediately at risk here. 

Getting closer to a market bottom

Image
The longer indices remain off their lows, the greater the probability those lows will become *the* low for the November-March decline. Again, focus should remain on the Russell 2000, which had suffered the largest relative loss over the course of 2021 but now finds itself in a leadership role in 2022 - despite the losses it experienced from November highs.  The Russell 2000 made further gains today as it pushes towards a cluster of resistance between $208-211 ($IWM), which also includes the 50-day MA.  Get past that, with the help of a MACD and On-Balance-Volume trigger 'buy', then we are looking at the 200-day MA and the start of a new base pattern (with a neckline marked by the November high). 

Support Holds Despite Weekend Futures

Image
After posting yesterday - then seeing the state of Futures Sunday evening - I thought I was going to be left with egg on my face, but support was well defined on Friday and today's action effectively confirmed these levels as working support.  Of course, we can still go lower from here, but given the economic state of Russia and the war in the Ukraine, today's action was very tepid.  The Nasdaq is about to run into its first piece of price resistance at the 20-day MA, but it does have a 'buy' trigger in its relative performance to the S&P, not to mention a (weak) 'buy' signal in the MACD. 

Bear Traps for Indices

Image
Friday delivered gains which regained real body support across lead indices.  Trading volume was light, but given the gains this wasn't too worrisome.  In the case of the Nasdaq, there was a close above the 20-day MA with a relative gain over the S&P.  The next target is likely to be the 50-day MA (which is currently trading near February highs)

A bottom for the Russell 2000?

Image
War has begun and Covid is near an end; I can only assume traders are 'buying' the war as I would expect the Covid rally to be sold when the virus eventually peters out.  The Russell 2000 ($IWM) looks to offer the best value as the current leg down as suffered none of the heavy volume trading the initial leg down in January experienced.  Today's white candle reversal did register as accumulation for this index - another reason to be positive (unless you live in Ukraine).  Also, with today's low at $187.92 the index is well placed to map a double bottom with the January swing low (with supporting bullish divergences in the MACD and Stochastics).  Technicals are net negative, aside from continued relative gains against peer indices. 

Archive

Show more