Posts

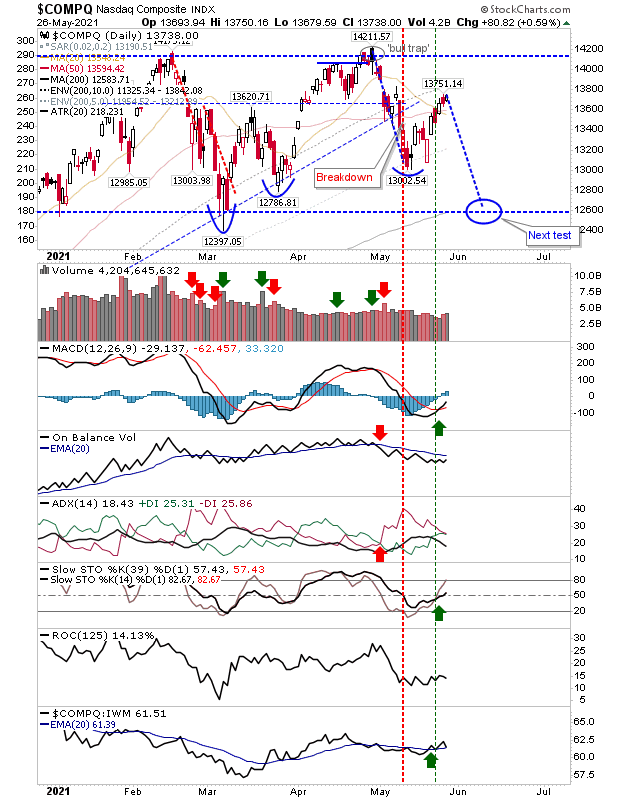
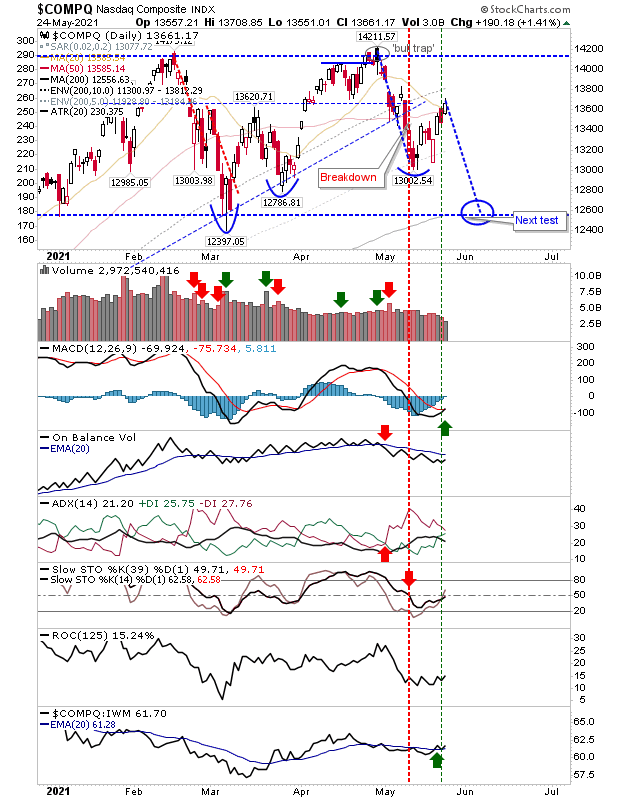
Relief rallies now at a crawl, but Russell 2000 net bullish

Image
The bounce is struggling to attract buyers with Friday's close registering as a small gain with low volume.   In the case of the Nasdaq, the measured move lower would deliver a tag of the 200-day MA, making it an attractive forecast. Technicals are mixed with 'buys' for the MACD and Stochastics, offset by relative performance shifting back in favor of Small Caps. 

Rally off May swing low slows

Image
The initial enthusiasm for the bounce from May lows is slowing as the intraday range tightens across indices.  The Nasdaq is trading above key moving averages with a MACD trigger 'buy' and a fresh 'buy' trigger in stochastics. However, the Nasdaq is in a trading range and until this breaks, any action within the bounds of support and resistance is just noise. 

Market gains take the edge off Friday's losses

Image
The gains were good to see, but all they did was extend the bounce off the March swing lows. We still need to see if there is going to be a positive test of the May swing low.  For the Nasdaq, today's gains managed to finish above both its 20-day and 50-day MA. Volume was light but gain did come with a MACD trigger 'buy'.  Not to mention, the index continues to outperform the Russell 2000.  The other side of today's action, is that each gain focuses the measured move lower on to the 200-day MA.  Convergence increases the possibility of it happening. 

Nasdaq, Russell 2000 and S&P run into moving average resistance

Image
The mid-week bounce ran into trouble by Friday's close as the Russell 2000, Nasdaq and S&P ran into their 20-day MAs, leaving behind bearish candlesticks in the process.  The Nasdaq and Russell 2000 also tagged their 50-day MA.  It could be a long week ahead for the indices. The Russell 2000 is still range bound, but I don't like to see 'black' candlesticks, particularly when near resistance, but real selling pressure doesn't kick in until $210 ($IWM) is lost. Technicals edge bearish with ADX and MACD firmly on the bearish side of the ledger, but On-Balance-Volume is zig-zagging and stochastics is caught at the mid-line. 

Nasdaq rallies as Russell 2000 remains flat

Image
All indices posted gains but it was the Nasdaq and S&P which did most of the leg work.  The gain in the Russell 2000 was able to close yesterday's breakdown gap, but not much more.  The gain in the Nasdaq was enough to consider the makings of a new rally off a swing low established last week, but there is a convergence of 20-day nd 50-day MAs to get past first.

Relief Rally fades across indices

Image
Markets lost ground, with the S&P reversing off trend resistance and the Russell 2000 doing a tag repel from converged 20-day and 50-day MAs.  Selling volume only ranked as distribution for the Russell 2000, but was not particularly heavy.  The S&P marked a picture perfect reversal with bearish technicals for the MACD, On-Balance-Volume and ADX. Bulls will look to the 50-day MA, an area of past support in March and more recently in May, but each repeated tag of this support level increases the opportunity for it breaking. 

Friday's recovery sets the groundwork for a swing low

Image
Friday marked the beginning of potential swing lows for the indices, although it will take more than one positive day to confirm such lows.  The Nasdaq is bearish across all supporting technicals including relative performance against the Russell 2000. The next test for this rally is the 50-day MA and converged trend support and 20-day MA. 

Archive

Show more