Popular posts from this blog
Relief Rally fades across indices
- Get link
- X
- Other Apps
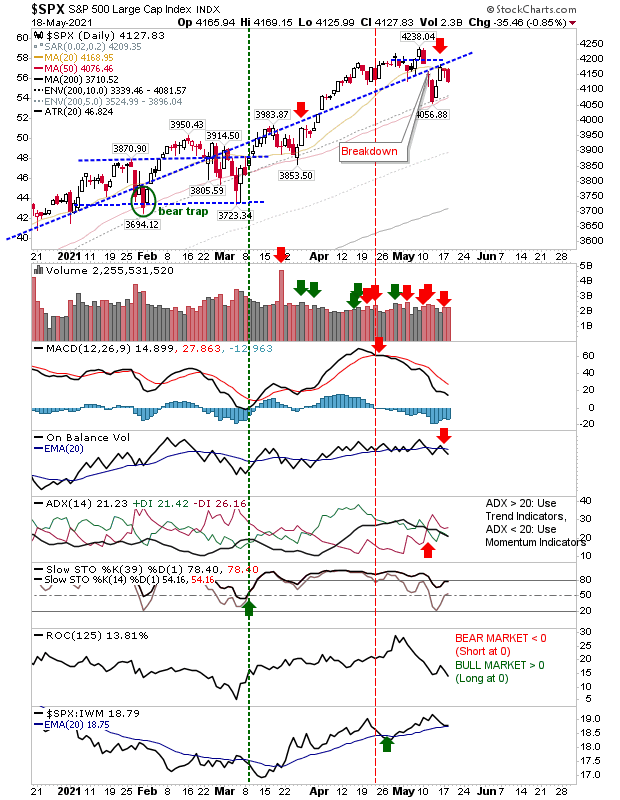
Markets lost ground, with the S&P reversing off trend resistance and the Russell 2000 doing a tag repel from converged 20-day and 50-day MAs. Selling volume only ranked as distribution for the Russell 2000, but was not particularly heavy.
The S&P marked a picture perfect reversal with bearish technicals for the MACD, On-Balance-Volume and ADX. Bulls will look to the 50-day MA, an area of past support in March and more recently in May, but each repeated tag of this support level increases the opportunity for it breaking.
The Nasdaq reversed before tagging either trendline resistance or its lead moving averages. Technicals are net bearish. If losses continue to tomorrow it would introduce the possibility of a measured move to 12,400 or a test of the 200-day MA. This would keep things in line with a trading range.
You've now read my opinion, next read Douglas' blog.
---
Accepting KIVA gift certificates to help support the work on this blog. All certificates gifted are converted into loans for those who need the help more.
Investments are held in a pension fund on a buy-and-hold strategy.
- Get link
- X
- Other Apps
Popular posts from this blog
Upcoming "Death Cross" for Russell 2000 ($IWM)
"Dead Cat" Bounce or Something Better?
Sell The News. Nvidia Can't Save Market - Worse To Come?
Archive
Archive
- March 202511
- February 20259
- January 202510
- December 20248
- November 20247
- October 202412
- September 202411
- August 20246
- July 202413
- June 202410
- May 202411
- April 202415
- March 202410
- February 202411
- January 202413
- December 202310
- November 202311
- October 202311
- September 202311
- August 202312
- July 202311
- June 20235
- May 202313
- April 20239
- March 202313
- February 202312
- January 202312
- December 202213
- November 202210
- October 202212
- September 202213
- August 202212
- July 20221
- June 202212
- May 202213
- April 20229
- March 202211
- February 202211
- January 202213
- December 20219
- November 202112
- October 202113
- September 202111
- August 202110
- July 202114
- June 202112
- May 202113
- April 202113
- March 202114
- February 202111
- January 202112
- December 20209
- November 202012
- October 202012
- September 202014
- August 202011
- July 202010
- June 202013
- May 202012
- April 202014
- March 202015
- February 202011
- January 202012
- December 201910
- November 201912
- October 201913
- September 201913
- August 20198
- July 20198
- June 201912
- May 201912
- April 201914
- March 201913
- February 201911
- January 201914
- December 201810
- November 20187
- October 201814
- September 201815
- August 201810
- July 201813
- June 201812
- May 201815
- April 201816
- March 201813
- February 201812
- January 201814
- December 201711
- November 201718
- October 201717
- September 201715
- August 20178
- July 201713
- June 201716
- May 201715
- April 201715
- March 201720
- February 201710
- January 201718
- December 201614
- November 201617
- October 201612
- September 201610
- August 201614
- July 20163
- June 201616
- May 201618
- April 201618
- March 20168
- February 201620
- January 201620
- December 201513
- November 201518
- October 201516
- September 201518
- August 201517
- July 201519
- June 201518
- May 201521
- April 201520
- March 201522
- February 201518
- January 201518
- December 201413
- November 201417
- October 201420
- September 201421
- August 201420
- July 20148
- June 201420
- May 201420
- April 201421
- March 201420
- February 201418
- January 201422
- December 201320
- November 201321
- October 201322
- September 201325
- August 201317
- July 201311
- June 201320
- May 201317
- April 201319
- March 201318
- February 201324
- January 201321
- December 201218
- November 201223
- October 201224
- September 201225
- August 201225
- July 201215
- June 201218
- May 201224
- April 201225
- March 201222
- February 201219
- January 201217
- December 201114
- November 201119
- October 201121
- September 201119
- August 201122
- July 201121
- June 201120
- May 20117
- April 201119
- March 201125
- February 201121
- January 201125
- December 201019
- November 201021
- October 201022
- September 201025
- August 201010
- July 201029
- June 201025
- May 201022
- April 201022
- March 201030
- February 201023
- January 201026
- December 200922
- November 200923
- October 200923
- September 200926
- August 200927
- July 200921
- June 200939
- May 200932
- April 200939
- March 200936
- February 200933
- January 200935
- December 200823
- November 200823
- October 200821
- September 200821
- August 200822
- July 200823
- June 200828
- May 200823
- April 200822
- March 200828
- February 200824
- January 200826
- December 200719
- November 200721
- October 200729
- September 200724
- August 200729
- July 200720
- June 200734
- May 200742
- April 200740
- March 200734
- February 200738
- January 200732
- December 200635
- November 200630
- October 200650
- September 200646
- August 200641
- July 200648
- June 200637
- May 200653
- April 200645
- March 200648
- February 200645
- January 200635
- December 200543
- November 200535
- October 20058
- September 20058
- August 20059
- July 20057
- June 200510
- May 20053
- April 200510
- March 20058
- February 200516
- January 200529


