Posts

Dow Jones Industrials continue to charge

Image
The last couple of days have seen the Dow Industrials Average grab my interest as it continues to ascend beyond channel resistance to new all-time highs. Technicals are all net bullish with the index sharply outperforming the Nasdaq 100; only volume disappoints (a little).

Dow Jones Industrials Posts New Highs

Image
It may only have thirty stocks, but those thirty stocks are wasting no time posting new highs. It's working as a lead index at the moment, with the Russell 2000 not far behind. With these indices doing most of the leg work there is a good chance they will drag the S&P and Nasdaq along with them. The Dow Jones Industrial Index is pushing itself beyond its rising channel, although volume is drifting lower. Technicals are positive and relative performance has been moving sharply higher since mid-February.

Surprise buying?

Image
Yesterday's action was unusual in that the 'bullish' hammers from Friday gave way to selling, but today's action added another layer of surprise by reversing Monday's selling with a fresh round of buying. Taking a step back and removing this noise of the last couple of days and we markets continuing their run off their highs. We are seeing a drop in volume in recent days (in both buying and selling), suggesting we are reaching the end of this particular decline. We just need a few more days like today to firm this swing low up. The Nasdaq jumped nearly 3.5% as it makes its way back towards its 50-day MA. Technicals are net bearish and were little improved despite today's big price gain.

Indices find support on bullish 'hammers'

Image
Bulls made decent intraday recoveries to close near highs on Friday - registering bullish 'hammer' candlesticks across the indices. These will offer a good launch point for next week.   The Nasdaq closed on higher volume accumulation as it finished with a bullish hammer off the early January swing low. Technicals are all net bearish, making the likelihood for a move into Friday's spike low relatively high - although I would be look for a more bullish move on Monday.

Nasdaq losses accelerate

Image
The potential 'bear traps' quickly stalled and sellers again returned to the fore. Selling in the Nasdaq undercut the lows of the 'bear trap' with a finish on the low of the day.  There was also a 'sell' trigger in On-Balance-Volume.  The wide intraday bar marks a change in the action since the beginning of this rally in November and today's volume marked a return to distribution,.

Bear traps for S&P and Nasdaq?

Image
We had a successful test of support for the Russell 2000 which delivered a low volume bounce with minimal improvement in supporting technicals.

Support break for Nasdaq and S&P

Image
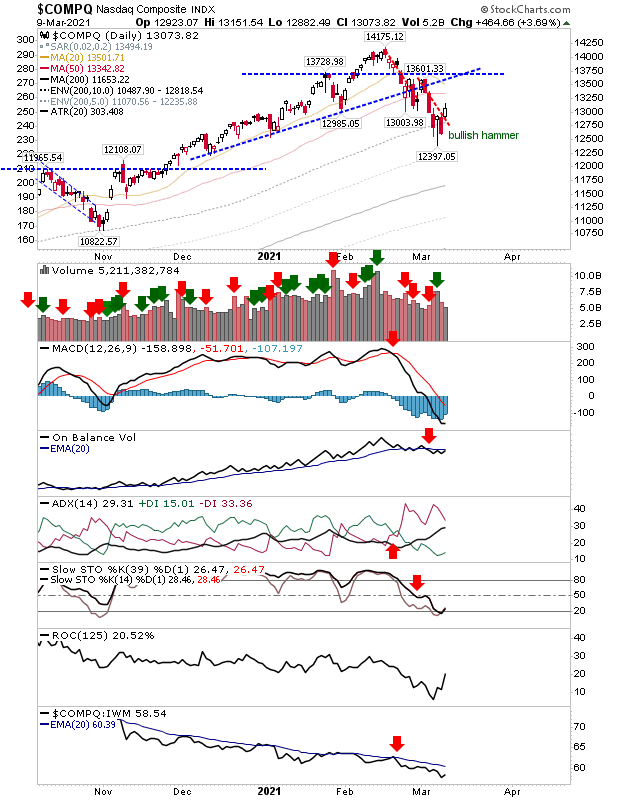
Indices have gone from new high breakouts, to 20-day MA tests, to breaks of trendline support - weakening at each step along way. The Nasdaq finished Friday with a loss of the 50-day MA after trendline support gave way on Thursday.  Friday's volume was relatively light, but there was confirmed distribution on Thursday's selling.  Technicals have taken a marked step lower, especially the MACD - although On-Balance-Volume is hanging on to its 'buy' signal. Intermediate stochastics [39,1] just undercut its mid-line, although a rally tomorrow would be enough to see this as the start of support for a secular trend pullback (although such a pattern would take time). 

Archive

Show more