Posts

Net Bullish Technicals for S&P and Nasdaq

Image
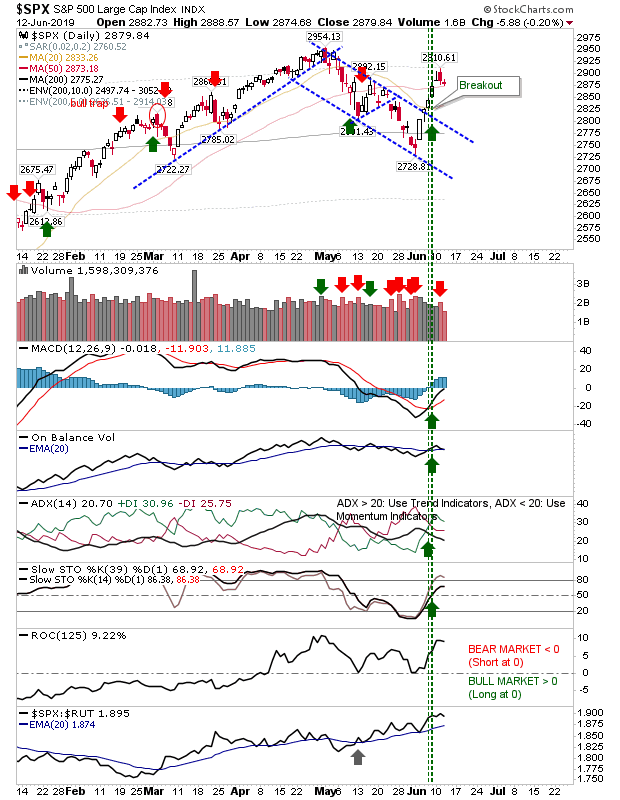
Since the last update we have seen significant technical improvement, even if the indices registered losses over the last couple of days. The S&P is now resting near its 50-day MA but there may not be sufficient wiggle room for it to be held as support. If this was to fail then next would be former channel resistance now support.

S&P and Nasdaq confirm breakouts; rallies start to build

Image
The S&P and Nasdaq were last to follow the lead of the Russell 2000, Dow and Semiconductor Index. It's now looking like respectable swing lows are in effect for all lead indices. For the S&P there was a close above the 50-day MA in addition to the follow through breakout. Technicals returned net bullish, making the 52-week high of 2,954 as the next challenge for the index.

Breakouts for Russell 2000, Semiconductors and Dow Industrials

Image
It was a bit of a mixed bag, although the basis for a probable swing low for markets is in place. Best of the action was in the Semiconductor Index where there was a clear break from the downward channel, which also coincided with a return above the 200-day MA. The consolidation below - and move above - the 200-day MA has the makings of a 'bear trap'. Next challenge is getting past the 20-day MA and if it can do this on the back of a MACD trigger 'buy' it will set things nicely for a challenge of the 50-day MA, then a larger challenge of the 52-week high at 1,604.

Nasdaq Suffers Heavy Selling

Image
Rumors of antitrust probes for Facebook and Google put a weak market under further pressure. The Nasdaq took the brunt of the selling on confirmed distribution. In the case of the Nasdaq I have redrawn the downward channel line which will place today's lows at support of this channel line.

Declines Continue

Image
It was yet another day bears maintained control of markets with the Russell 2000 again leading markets lower. The Russell 2000 is looking at swing low support of January 2019 after breaking below horizontal support. Converged moving averages (20-day, 50-day and 200-day MA) are now major resistance but markets would be a a month or two away from this test even if there was a rally now.

Russell 2000 Breaks Range Support

Image
It didn't happen today, but the Russell 2000 didn't waste any time losing 1,500 support. With technicals oversold there is a chance this could evolve into a larger crash but other indices aren't showing the level of weakness which could offer this scenario.  Not surprisingly, relative weakness ticked lower despite its recent relative strength.

Distribution Sweeps Markets

Image
Traders returned from the Memorial weekend in selling mood. Indices, already net bearish technically, suffered further losses on higher volume distribution. The S&P is on course to test its 200-day MA, although relative performance continued to accelerate against its Russell 2000, which will be a cold comfort for current longs, but may be enough to prevent losses from getting too bad.

Archive

Show more