Posts

Russell 2000 Defends Support

Image
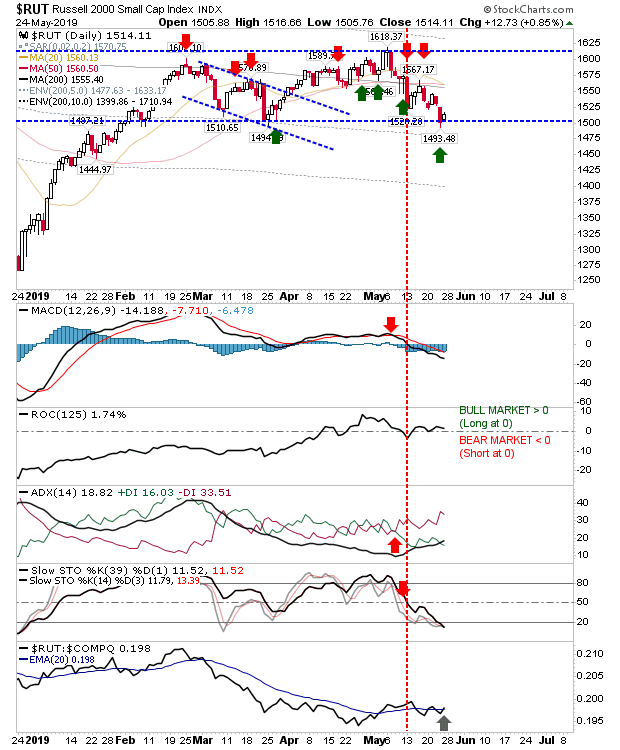
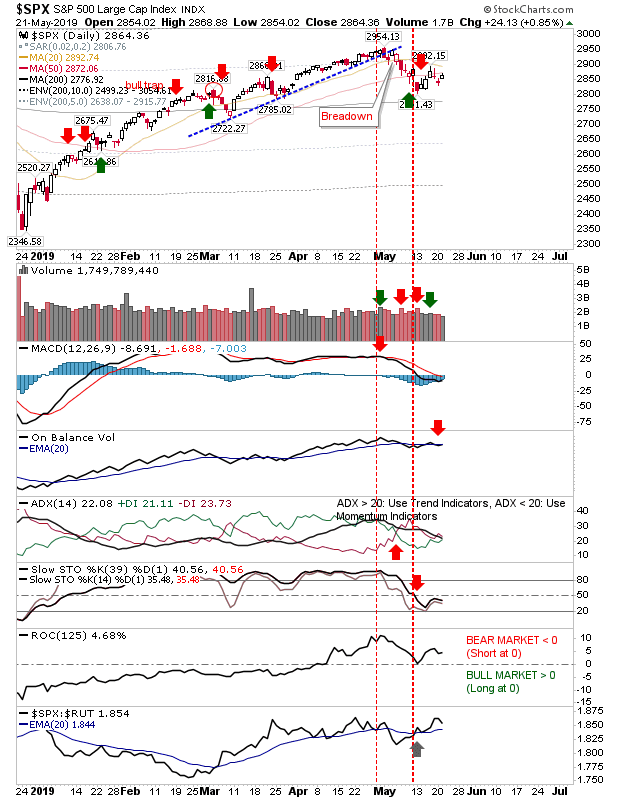
Friday was a bit of a mixed bag. The Russell 2000 was able to defend horizontal support as it continues to build a sideways pattern. While it trades sideways it will keep other indices in check until there is a confirmed directional turn - either a break of current support (for bears) or a rally back to, then beyond 1,615 resistance. With the Russell 2000 caught inside a trading range, the breakdowns in the S&P and Nasdaq are caught in a bit of a no-mans land. As the Russell 2000 failed to break its support, both the S&P and Nasdaq are vulnerable; not just to additional losses, but also to a 'bear trap' and a rally through their respective consolidation triangles. While the Russell 2000 defending support, Semiconductors are heading in the other direction with an undercut of the 200-day MA. Further losses in this index will drag the Nasdaq and Nasdaq 100 with them. Finally, the relationship between Transports and the Dow Jones Index continued to struggl

S&P and Nasdaq Breakdown

Image
Today's losses ranked as a breakdown of the consolidation triangle in the S&P and Nasdaq. Volume climbed to register as distribution for both indices. Technicals are already net bearish.The one caveat is the surge in relative performance of the S&P against the Russell 2000.

No change part 2

Image
With Trump Trade Wars in full swing, markets were remarkably sanguine. It's still a mixed bag of bullish potential in the Russell 2000 and bearish malaise in the Semiconductor Index. Having said that, it wasn't a great day in the Russell 2000. The Russell 2000 gave back most of yesterday's gain and is set for a push below 1,521. If this happens it will set up for a new swing low and confirm a new channel trend lower.  Technicals do not inspire as it also lost relative ground against the S&P.

No change as Markets trade within a range

Image
Markets made minor gains, but the action of the last few days has not managed to clear the consolidations created near the moving averages. In the case of the S&P, the index is trading around the 50-day MA. Volume was lighter on the upside but technicals are net bearish but not oversold. If this is to be a swing low there isn't much room for maneuver and bulls need to follow through higher over the next few days.

Indices Rebuffed at Moving Averages

Image
Friday saw indices turned at moving averages after Thursday's tests. Volume was light, so it may be a mix of profit taking and some aggressive shorts. In the case of the S&P, the bounce in the market was not enough to reverse the bearish technicals and may have even pushed them into a shorting zone. The 50-day MA is acting as resistance. On the plus side, there is a continued advance in relative performance against the Russell 2000.

Bounce sees markets challenge moving averages

Image
Since the Tariff sell off markets have managed to pull themselves back to the moving averages broken by that sell off. Buyers of the bounce off the 200-day MA in the Dow Jones Average are sitting pretty with another 100 points on offer before the 50-day MA is tested. Volume is light and technicals are mixed, but there has been a recovery 'buy' trigger in On-Balance-Volume.

Technical Damage Across Markets

Image
The to-and-fro of the US-Chinese trade war has left markets in a bit of a grey zone and facing uncertainty after holding moving average support. The S&P undercut its 50-day MA on higher volume distribution, but it also came back with a relative performance improvement. Technicals are net bearish.

Archive

Show more