Posts

Indices continue to struggle at 20-day MA

Image
Irrespective of the market reaction to the jobs figure, the indices 20-day MAs have held fast as resistance since August (bar one blip in early November which quickly evolved into bull traps). Nasdaq clearly shows the pain: S&P not immune - although it has nicked a couple more crosses in recent weeks: Given the proximity of indices to this average and the negative hit to the futures following the loss of 533K jobs , the likelihood of challenges to the 20-day MAs is unlikely until the latter part of next week - assuming no rout past November lows. Get the Fallond Newsletter Dr. Declan Fallon, Senior Market Technician, Zignals.com the free stock alerts, market alerts and stock charts website

Zignals Stock Charts: Nokia

Image
More happy news, this time from Nokia . HELSINKI (AFP) - Nokia (Xetra: 870737 - news) , the world's leading mobile phone maker, on Thursday lowered its outlook for the global cell phone market this year and offered a bleak forecast for 2009. "The mobile device market slowdown has continued more rapidly than previously expected," Nokia said, adding that it "now estimates that fourth quarter 2008 industry mobile device volumes will be lower than the previous estimate (it gave last month) of approximately 330 million units." Market participants look to have shrugged off the news with buyers unwilling to step in to halt the slide. There is a chance for bulls to break resistance from September highs through to December which can generate a push to €13.40 (larger declining channel resistance). One for short term traders. On Zignals Stock Charts , YourCall, there is only my opinion for a push to €18.15 with a stop at €9.59. If you have an opinion on Nokia (or any other

Semiconductors try again to break

Image
Ahhh....those dreamy January days when I thought the worst was behind the semis. Things were looking rosy in March and it did manage a test of its 200-day MA, pushing to a high of $33.69, but after that it was all down hill. Almost a year has passed since the semiconductor HOLDRs (SMH) knocked around $29-30 range, now they trade in the $15-16s. Since August the declines have been withering; 2002 lows of $15.97 were breached and the sector is down 84% from its 2000 highs - a Depression if ever I saw one. I mention it now because it is one of the first sectors to gain strength after a recession. Not that it is doing much 'leading' or showing great 'strength' but it has managed to break the August-November decline. This break needs to challenge the 50-day MA quickly so bulls can absorb the inevitable selling likely at this important moving average. The index was unable to absorb the double whammy of 50-day and 200-day MA convergence in August but now it has room to make

Zignals: 1974 again - except worse

On November 20th the S&P closed at 752. In the context of the last fifty eight years this is the worst performance the S&P has ever recorded. In 14,368 data points, the past six weeks rank 14,349th to 14,368th with respect to S&P performance relative to its moving averages (20-, 50-, and 200-day MAs). On the day it closed at 752 the S&P finished 16% away from its 20-day MA, 25% from its 50-day MA and a staggering 40% from its 200-day MA. The only other year in recent memory to come as close was October 3rd 1974. Then the S&P closed 7% away from its 20-day MA, 14% from its 50-day MA and a comparably bullish 29% away from its 200-day MA. For the month of December, taking the post September/October routs into perspective, 1987 was the only other year coming close to matching now. Then the S&P lingered 2% from its 20-day MA, 10% from its 50-day MA and only 20% from the 200-day MA (this was for December 10th 1987). Bears and worried bulls could look to December 1973

Very little to add....

Image
On a closing price basis the S&P finished the day just below former channel support (now resistance). Volume made modest gains, but not really enough to suggest it was a strong accumulation day. Supporting technicals continue to map bullish divergences, some dating back to the summer - so that's a good thing. Even when you look at only the closing price there is still tonnes of wiggle room without changing the picture strongly bullish or bearish. The TICK chart has swung more in favour of longs: Gold ( GLD ) struggling at its 50-day MA after a failed test to break resistance from Sep/Oct: Volatiltiy ( VIX ) angling for a move back into the void: Get the Fallond Newsletter Dr. Declan Fallon, Senior Market Technician, Zignals.com the free stock alerts, market alerts and stock charts website
Another Downdraft?

Image
Markets sit in a dicey position after Monday's key sell off. Volume was surprisingly light considering; whether this reflects the slow trudge back to work on the part of traders, or a genuine lack of sellers will become clearer as the week matures. I suspect December is not going to tell us much as many will want to put this year behind them as quickly as possible so it could be a very non-descript month. Russell 2000 gives a good indication of the plight for the markets. I don't like the stranded slow stochastic in neutral territory; it suggests there is plenty of downside room before it turns oversold. How will late November lows hold as support? With Monday's reversal we now have new necklines to consider as resistance: Watch how the bullish divergence in money flow plays out: Get the Fallond Newsletter Dr. Declan Fallon, Senior Market Technician, Zignals.com the free stock alerts, market alerts and stock charts website

Zignals Stock Charts: Ryanair vs Aer Lingus

Image
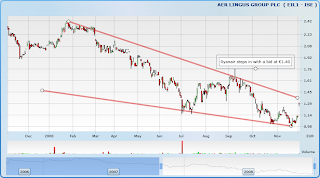
Michael O'Leary has made a bargain basement offer for Aer Lingus. With oil prices down at 2007 lows the coming months should be 'better' for the industry - even if this only translates to 'less worse' than other industries during the recession. From the Irish Times Ryanair has launched a second bid to purchase Aer Lingus in an offer that values the carrier at €748 million, or approximately half the value of its first bid. The €1.40 a share cash bid represents a premium of around 28 per cent over the average closing price of Aer Lingus shares for the 30 days to November 28th, 2008. Ryanair already owns almost 30 per cent of Aer Lingus shares and said in a statement it is proposing a “merger of the two airlines into one strong Irish airline group under common ownership”. At 1.12pm Aer Lingus shares were 16 cent or 14 per cent higher €1.28, while Ryanair stock was flat at €2.93. What could this mean for Ryanair's stock price? Since the start of the year the stock h

Archive

Show more