Posts

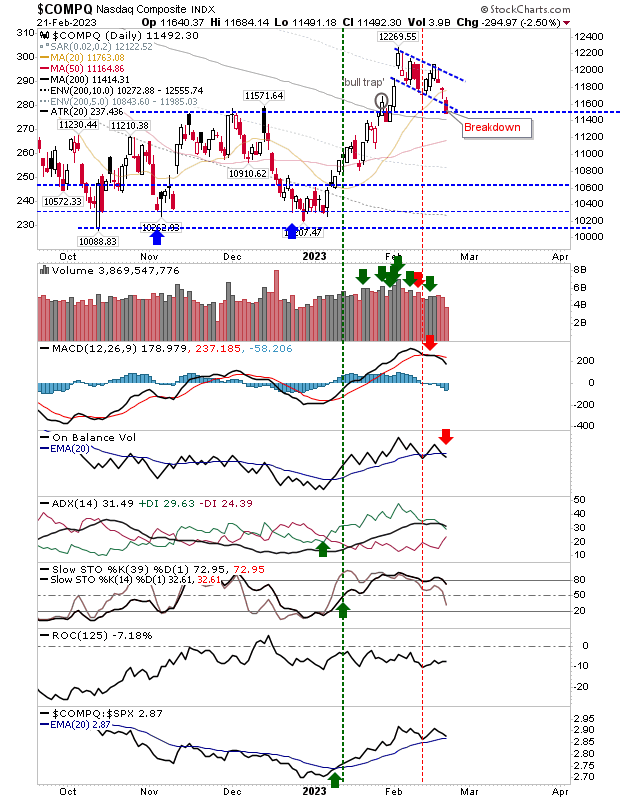
Eesh, today's bearish candlesticks are a problem

Image
I don't like seeing 'black' candlesticks as they reflect a failure of opening strength, and today was one of those days.  'Black' candlesticks are more of a problem at the end of the rally than at the start, but if we see a gap down tomorrow there won't be much support to lean on.  The S&P and Nasdaq might yet see another test of the 200-day MA tomorrow. However, if there is a close above today's high, the bearishness of the 'black' candlesticks is negated.

S&P and Nasdaq lean on 200-day MAs

Image
Friday saw indices take another hit lower, but most of the damage was done at the open (with gaps lower) and by end of day, the S&P and Nasdaq finished with small doji, rather than any more catastrophic candlesticks. The Nasdaq is still close enough to key breakout support that a rally on Monday could see this support regained and a 'bear trap' established. It will have to be the next one or two trading sessions for this to be confirmed.  Any further loss now would instead open up a test of the 50-day MA, and potentially, a move back to 10,600s. Futures are looking good for a bounce, so let's see what the day brings.

Markets find support at Nov-Dec peaks

Image
It was a bit of a sketchy day for markets, but they were able to recover by the close of business.  I would have preferred markets to have honored my earlier drawn 'bull flags', but markets don't do what you want, so instead, we have to play by the rules they give us.  The Nasdaq has managed to dig in at support defined by the swing highs of November/December, but also the 200-day MA. Today's candlestick registered as a bullish hammer and there was a new 'buy' tick in On-Balance-Volume. The index continues to outperform peer indices. 

Room for maneuver lost as key breakout support disappear across indices

Image
It was a bad day in the end for markets as it appears traders spent the President weekend stewing in their juices.  Not all markets lost support, but there wasn't a whole lot of positives coming out of today.  The Nasdaq broke below 'bull flag' support, but not enough to register a distribution day - perhaps the best piece of news to come out of today.  Because today's candlestick was a solid red one, I'm not convinced we will see a successful support test tomorrow, but I would give the Nasdaq until 2pm to stage a recovery *if* the index is down for the day; a spike low with a close at or above support would be a positive. 

Markets hold breakout support, but limited room for maneuver

Image
Markets took another loss on Friday but there was no change in the larger picture.  The key breakouts remain intact, and we are still waiting for the Dow Jones Industrial Average to make its move, but it remains close. In the case of the Nasdaq, I have redrawn the boundaries of the 'bull flag' to consume the early - now failed - move from the consolidation.  Friday's finish didn't break support of its 20-day MA and from a volume standpoint, didn't rank as distribution.  Techniclals have a 'sell' in the MACD, but its the relative performance advantage which likely holds the key as to which direction we can expect the 'bull flag' to break.  Optimistic.

'Bull Flag' breakouts hit a road block

Image
Yesterday's gains offered classic 'bull flag' breakouts, but today put a dampner on many of those market moves.  The Russell 2000 opened near the low of Wednesday, and despite an intraday surge to yesterday's highs, it found itself closing just below it's open price - registering a distribution day in the process. Technicals haven't changed, although relative performance is improving against the Nasdaq.

Nasdaq, S&P and Russell 2000 all shape 'bull' flags

Image
As markets retreat back to support, they do so by building 'bull flags'.  This action - if it delivers the expected breakouts - will open up for measured moves higher. In the case of the Nasdaq, we have a measured move target around 14,000.  However, there is a 'sell' trigger in its MACD, but this shouldn't offset the strong relative performance of the index to the S&P. 

Archive

Show more