It was another day bulls chalked up a victory and indices posted gains across the board. Some indices did better than others but there is no clear weakness to work off yet.
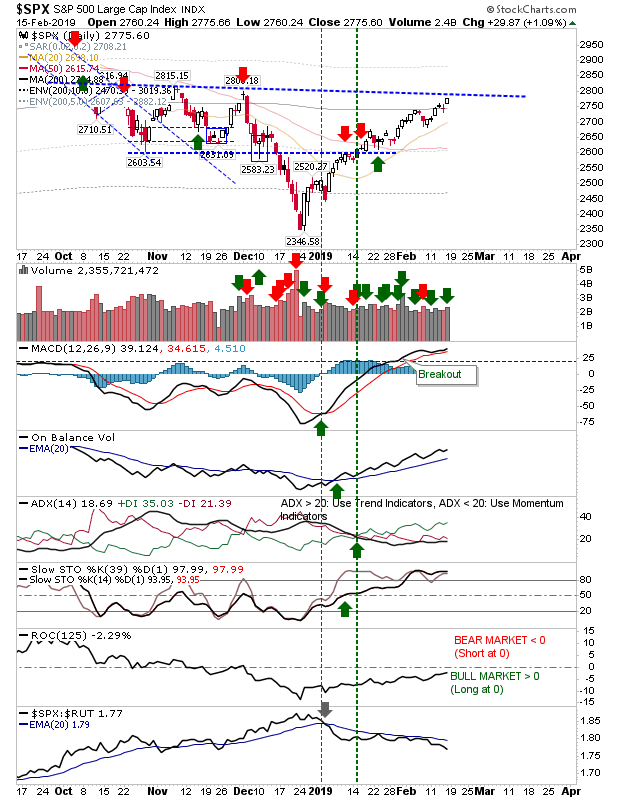
The S&P was able to break past its 200-day MA on higher volume accumulation. However, it's coming up against declining resistance. The MACD has already cleared comparable resistance with new highs which would suggest the S&P will be able to do likewise. Other technicals are in good shape and only relative performance (vs the Russell 2000) is underperforming.
The Russell 2000 was one of the biggest winners on Friday as it pushed on after its earlier week break of declining resistance. Next up is its 200-day MA. The index was hardest hit by December selling and it still appears to be benefitting from buyers who view this as the 'deep discount' offer. Of all indices, it has the strongest relative performance advantage and is the one most likely to continue its run of gains. When the overall rally eventually stops its likely to be Large Caps which will be first to crack before the damage hits the Russell 2000.

The Nasdaq had a relatively low key day as the index stalled out at its 200-day MA on a narrow-range doji. Other technicals are all in good shape, including a relative outperformance against the S&P - which cleared its 200-day MA on Friday. Look for the Nasdaq to follow suit this week. Aggressive shorts looking for a play could try and attack the 200-day MA, particularly if there is a gap down on Tuesday (fade the counter-rally back to the 200-day MA). Longs who bought the 50-day MA retest in January should probably take some profits (sell covered calls?) for what is a nice gain.
The Semiconductor Index continues to inch along channel resistance. Surprising how strength in this index hasn't filtered through to the Nasdaq and Nasdaq 100, particularly as the Semiconductor Index is trading up against September action.
Of other charts, there was a cross in the Nasdaq and NYSE new 52-week highs and lows, further suggesting a significant swing low is in play.
For Tuesday, if sellers make a go of it then the Nasdaq is looking the most vulnerable to such losses. The Russell 2000 still has some wiggle room to add some gains before reaching natural resistance.
You've now read my opinion, next read
Douglas' blog.

---
Accepting KIVA gift certificates to help support the work on this blog. All certificates gifted are
converted into loans for those who need the help more.
Follow Me on Twitter
Investments are held in a pension fund on a buy-and-hold strategy.