Was today's reversal another short covering rally or the basis for a swing trade low. It was a frustrating day for myself as having effectively nailed the Dow low with an entry at 17,140 (which was a support level on the hourly time frame), I jumped ship just before the rally kicked off. C'est la vie. Volume climbed to suggest a possible capitulation. The problem remains the trading ranges which offer whipsaw risk all around (and keep me flighty in the market).
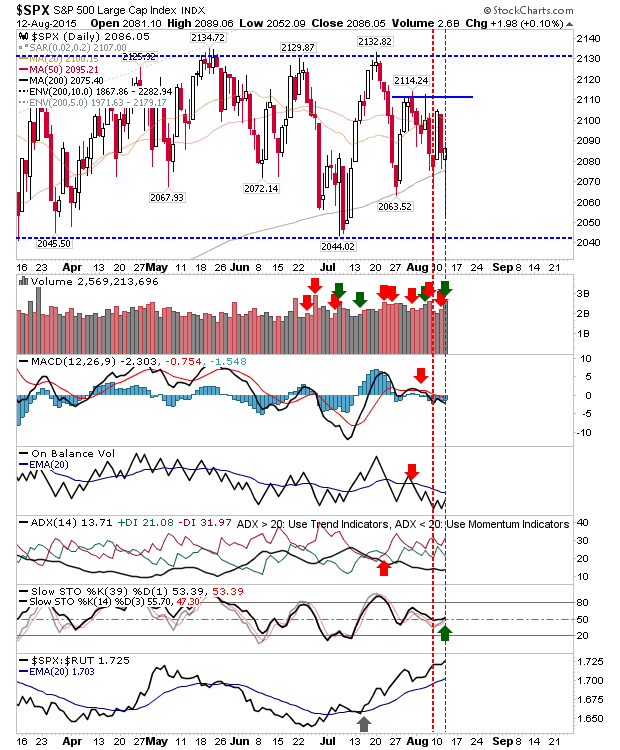
Of the indices, the S&P was again strong enough to finish above its 200-day MA, but the long standing trading range of 2,044 and 2,130 has contained all of these recent swings. If there is some follow through upside, then watch watch happens when it gets close to resistance at 2,110.
Those who follow
Andrew Thrasher may be interested in a chart he had on his site which I recreated to keep an eye on. It marks weekly support, removing much of the noise of daily action. A loss of this could be the start of larger declines. Also note the drift in momentum as measured by the RSI.
The Nasdaq returned above 5,038 but it too will find supply lurking at 5,096 and again at 5,150. Those who caught the 'bull trap' will be very happy if still short. A test of the 200-day MA feels needed.
Another of Andrew's charts (I think?) is a 9-month MA. This one covers the Nasdaq, and again, warns of possible further downside in the intermediate to longer term. Corrections are relatively frequent, but it has been years since the last, good sell off.
The Semiconductor Index staged a good recovery, although it would have taken a brave person to have taken a punt at the open; I have redrawn support and resistance to accommodate recent changes.
The Nasdaq 100 rallied off newly adjusted channel support/resistance. There is the makings of a 'bull flag', but plenty of work to do. Of the indices, it's the only one not to turn net negative technically.
Small Caps also enjoyed a rally, but it's first step is to regain the 200-day MA. The spike low is a little isolated, although 1,200 was problematic resistance in early 2014, and is now support.
The Chinese scenario is more interesting than the Grexit. It appears every overnight session brings its own excitement. It's this uncertainty which is rattling the market, driving big declines and rapid short covering rallies. But until trading ranges break it's going to be hard to define broader market direction.
You've now read my opinion, next read
Douglas' and
Jani's.
---
Accepting KIVA gift certificates to help support the work on this blog. All certificates gifted are
converted into loans for those who need the help more.
Follow Me on Twitter
Dr. Declan Fallon is the Senior Market Technician and Community Director for
Zignals.com, and Product Development Manager for
ActivateClients.com. I do a weekly broadcast on Friday's at 13:30 GMT for
Tradercast, covering indices, FX and gold, silver and oil - all are welcome! You can read what others are saying about Zignals on
Investimonials.com.
JOIN ZIGNALS TODAY - IT'S FREE!