The last real trading week of the year has been a bit of a mixed bag. Santa will soon have come and gone, so is this it for his rally?
Yong Pan has taken a distinctly neutral tone to his S&P breadth indicators, although his S&P take is bullish (with the exception of the single bearish signal 'creep')
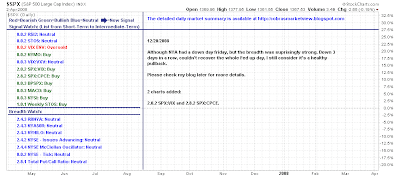 The bearish wedge remains in the SPY, except now things are looking overbought (and vulnerable to a sell off):

Breadth indicators all showing 'buys'; intermediate time frame bullish even if the short term is a little rich:

If there is a consolation prize it's that there hasn't been a significant distribution day since the post-Thanksgiving sell off:

Maurice Walker has a bullish cross on record for the Aroon indicator:

Maurice anticipates this rally lasting until the end of January (I think it will end around this time too) when 4Q GDP is released:
The 4Q advanced figure will be announced towards the end of January 2009. I think the market will rally for a while and peak towards the end of January, as this number is announced. I believe that it will set off a knee-jerk reaction at key resistance forming a neckline on the daily charts, setting up a complex inverse head and shoulders pattern. The 4Q GDP data will allow the right shoulders to form, bring about violent choppy moves in February. I plan on selling at resistance using the hourly/daily charts, and then swing trading the sporadic moves using forming the right shoulders via the 15- and one minute charts.
Maurice on the Aroon:
Aroon
The Aroons on the daily index charts got bullish crosses last Thursday. There are three methods of interpretation for the Aroon. These are rules that can be applied to help us trade the market.
1. If the Aroon up remains steadfast between 70 and 100, a new up trend has been signaled, expect prices to rally higher.
2. If the Aroon down falls below the level of 30 while the Aroon remains above 70, it indicates that the rising trend is strong. When the Aroon up is at 100, it tells us that the bulls are back in town, and a trader can anticipate a very strong trend.
3. When the up and down lines move in sync, parallel to one another, a consolidation phase is under way.
He continues:
Just after the election day highs on November 4, prices on the S&P 500 and the DJIA began to for the head of larger complex head and shoulders pattern on their daily charts. That has caused prices to move lower, dropping below the left shoulders and then begin to rise again in a V-shape. This has developed a lateral trading range between 1007 and 741, where consolidation is occurring developing our large reversal pattern. But now the up and down lines have parted, going their separate ways on the S&P 500 daily chart. Last week, the Aroon lines crossed, a the Aroon up moved above 70, while the Aroon down dropped below 30.
This crossover was confirmed on the S&P 500, by the Aroon oscillator nudging above +50, for the first time since our September 4 sell signal came. Notice that in mid-November the Aroon got a bullish cross, but it was never confirmed by the Aroon oscillator.
Now those of us who use technical analysis got several buy signals that have already put us long ages ago. But with the MACDs on the daily charts hovering just below the zero lines, this bullish event on the Aroons, could be signaling that they are about to move into positive territory. If the MACDs rollover at the zero lines it would murky up the waters of this rally. Right now the odds remain with the bulls. But the zero line on the MACD is the line in the sand. The bulls need to penetrate through it in order for the momentum to continue.
The short-term momentum on the stochastic is bearish. The stochastics put in lower peaks on the daily charts and then hooked over having turned bearish. The saving grave is that they remain above the value of 50 for now. A push below 50 on the stoachastics could pull the bearish trigger on the MACD.
On the VIX things are decidely bearish:
The VIX daily chart did a free fall to the double top confirmation line near 44 %. The catalyst was the VIX hourly chart, which broke down from a head and shoulders top, as the second peak was carving out the double top patten on it?s daily chart. Additionally the VIX say it's direcitonal movement indicator (DMI) get a bearish cross early last week, as the postitive DI crossed above the negative DI line. Meanwhile, the ADX line bottom and is now inching its way back up to 20. That is a bearish sign for the VIX and may help the bulls put the final nail in the coffin on VIX's casket. Last week the VIX?s MACD moved below the zero line in weakness. The VIX may become a bit stubborn in breaking it's DT pattern. It may kick in it's heels, at the confirmation line and even attempt to rebound. But I do think the bulls will cause the VIX to be dragged below the confirmation line at 44 %.
You can find out more on his website:
thechartpatterntrader.com
Richard Lehman has broader (slower) downchannels at play:
12/20 -- This past week importantly shows that the short term uptrends off the lows just before Thanksgiving are waning and have gone essentially sideways. (The large caps are actually now trending slightly lower while the small caps are still trending slightly higher -- remember, this is the time of year that starts to happen.) All equities are waning, however, and that could well be the precursor to a resumption of the decline. (A healthy premium in the VIX January futures supports that contention.) The Naz is coming up to its long term downtrend line and the QQQQ is right there also (RUT already punched through), but the Naz is up 23% off its low in a month. Can you justify another big up move from here on top of that?
The longer term charts did break a number of one-year downtrend lines before pulling back. I suspect these breaks will turn out to represent a new slope for the long term downtrend rather than a bonafide break back to a long term uptrend yet. Given the expectations for the length of this recession, that would make a lot more sense than any kind of sustained upmove yet. If that is the case, we would trade lower toward a retest of the lows in the first quarter. At this point, however, end-of-year window dressing and tax selling will likely kick things around over the holidays first. In the immediate term, we have rolled over into a downward mini and we'll just have to see how that plays out.
GLD is finally correcting after making a perfect hit to its declining long term line. A little patience may give you a chance to get long GLD at a much more attractive price.
Joe Reed week in summary:

No shortage of negative sentiment on the dollar, but this chart looks bullish:

I like the accumulation/distribution channel representation for the Dow:

Finally, Ted Burge has a ATR point-n-figure chart with a GLD target of $114.76; interesting...

Dr. Declan Fallon, Senior Market Technician, Zignals.com the free stock alerts, market alerts and stock charts website


