Posts

Modest weakness in Bullish Percents

Image
There is a sense things are getting a little toppy in the Bullish Percents. The S&P Bullish Percents have moved to a 'Sell' trigger at a resistance level marked by December highs. Unlike December, the S&P is above its 50-day MA, so it may simply be a blip on the road to higher levels. But it is a warning sign: Bullish Percents for the Dow and Nasdaq were flat and haven't yet marked future weakness.

Road Works Ahead: Gap test

Image
Thanks to TraderMike for the link-love. With Tech and Small caps getting hit with above average selling, there is an indication Large caps will follow suit; the three day sequence of lower highs and lower lows - albeit on tight trading - tends to favor a break to the downside. As noted by TraderMike , the 50-day MAs will be key support across the board. Certainly market breadth indicators are calling for a breather in the near term. The best example of a (short term) overbought breadth indicator is the S&P Bullish Percent. Look for a push to 1,315-1,335 in the S&P:

Nasdaq 200-day MA vs 50-day MAs

Image
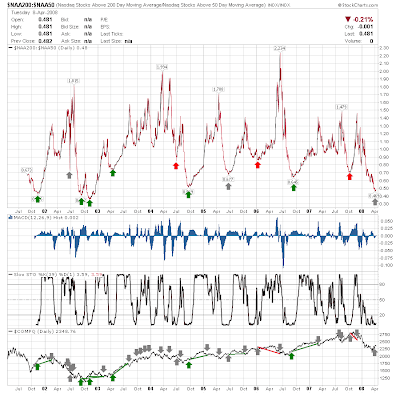
The relationship between the number of stocks trading above the 200-day and 50-day MAs describes the internal health of an index. It is not an ideal indicator, with obvious spikes not necessarily correlating to inflections in the market. This is especially true for spike highs where the number of stocks trading above the 200-day MA is greater the number above the 50-day MA - a situation associated with an overbought market. It is not uncommon to see such spikes occur during a well established decline (and in the case of 2002 spike highs, near the end of the decline). The ratio smooths into a more rounded bottom when the number of stocks above the 50-day MA is greater than the number above the 200-day MA. This situation is a little more helpful in pin-pointing bottoms, especially when the ratio shows twice as many stocks above the 50-day MA than 200-day MA (i.e. a ratio of 0.50 or less). Currently there are just over twice as many Nasdaq stocks above their 50-day MA than 200-day MA (0.4

Mind the Gap

Image
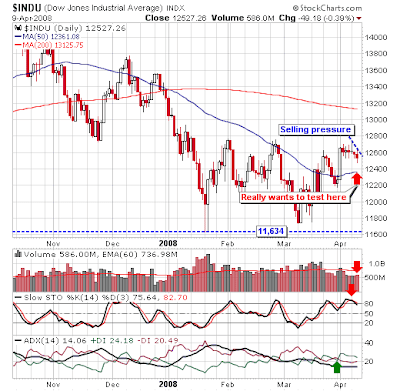
The intermediate time frame looks good for the markets with Bullish Percents on a tear: But the short term is overbought and itching for a confirmation test of the breakout gap and/or 50-day MAs: Futures favor a weak open, so this could be impetus bears need to work the market lower. Trade my Stock Picks at

Stockcharts.com weekly review

Image
A good week for bulls. How did the Stockcharters see it? Dr. Joe hints at possible trouble ahead: DURING an ELECTION YEAR the PRESIDENT'S PARTY does not want to go into an election with a weak economy. It looks bad, never-the-less, it is Here Now. So, the FED RES keeps slapping on 'Band Aids' to stop the bleeding. Yes, the market is weak, but at least it hasn't Crashed... YET. How long the FED RES 'C.P.R.' will continue to resuscitate this wounded market is questionable, but I think they're probably running out of bandages. (3-14-08 dr.joe) Remember, a RECESSION is all about TIGHT MONEY. If that's true, we're definately there now. But the Yield Curve has Not Inverted yet, which not always, but usually happens. Now here's the kicker... *A Recession starts when we have TWO STRAIGHT QUARTERS OF ECONOMIC SHRINKAGE, which means it can only be DECLARED IN HINDSIGHT. Heck of a deal, huh? (But good to know for sure) Right now Eco Growth has slowed to 1/

New KIVA loans: 50 reached!!!

Image
Another round of payoffs have freed up some funds for new loans from prior subscriber contributions. I have two new loans to make to bring the total of loans offered to 50 ! You can see where this money has been allocated and it is all thanks to the support of my subscribers. The first loan is to the Stage Hera Kende Self-Help Group Solomon has been in the business of buying second-hand clothing in bulk and retailing the same. He is married with 4 children who are all school-going. He buys the clothes in bulk from Nairobi and transports them to Kisumu for retailing. He has been in this business for over 5 years now. One of his primary motivations for choosing this business is because of the readily available market due to the high poverty levels in Kisumu town. He buys his stock every 2 weeks and sells the clothing not only in Kisumu Town but also in neighboring markets on the outskirts of Kisumu. He goes to these markets on their specific market days. The post-election violence in Ki

JAKKS Pacific

Image
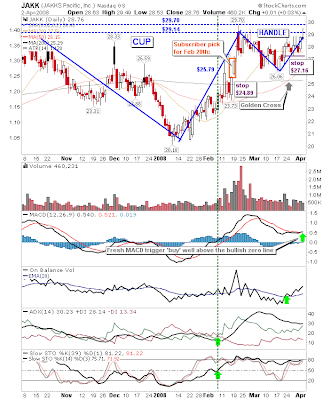
JAKKS Pacific ( JAKK ) was a featured newsletter pick for February 20th [ $ ] . The stock since shaped a solid looking cup-and-handle pattern with rising accumulation on the back of a fresh MACD trigger 'buy' (well above the bullish zero line). The original stop of $24.89 can be raised to about $27.16, although those looking to allow a little more room can allow for a stop just below the lows of the handle at $26. The push to $29 was enough to trigger a Triple Top Breakout on February 21st in the point-n-figure chart which reversed the previously bearish target of $13 to the bullish $46. A projected base target is closer to $42. On the Options side, January 09 $15 strikes trade from $14.80 from the Ask, although there is not much in the way of open interest. Trade my Stock Picks at

Archive

Show more