Posts

S&P runs alongside channel resistance; ready to accelerate

Image
The headline would have been a small loss, but S&P action over the past week and a bit has been for an index running alongside upper channel resistance, looking ready to break through higher. Technicals remain net positive, although the MACD is close to a new 'sell' signal. Even if this was to materialise, I would be surprised if it brought any serious selling and may offer a better buy-the-dip opportunity.

Buyers step in to support indices

Image
It wasn't a cavalry charge, but buyers stepped in to break the two days of selling in the Nasdaq and Russell 2000. While buying volume was relatively light compared to last week's selling, it does give bulls a chance to continue the rally within in the rising channel. The Russell 2000 ($IWM) is steadily building its gains as it moves along in the middle of its channel. As long as momentum remains overbought it will give bulls the underlying demand to keep things rolling higher.

Second day of selling for the Russell 2000

Image
Friday's selling in the Russell 2000 ($IWM) added to Thurday's down day, and volume rose in confirmed distribution.  This built on the Wednesday doji and its reversal potential at the end of a rally.  Despite this, technicals remain net positive.  There is of little real concern until we see a test of breakout support around $189 and/or the 20-day MA (which is close to $189). The Nasdaq is also easing back to breakout support along with the fast rising 20-day MA. Unlike the Russell 2000 there is creeping bearishness in the technicals with a MACD trigger 'sell'. In addition, the Nasdaq has moved to a period of underperformance relative to the S&P. There is still plenty of room before support is tested, but it's likely to do so before the other indices. The S&P held up the best on Friday, but the 'black' candlestick is not ideal.  However, because the volume was up it will record itself as accumulation.  The S&P is outperforming the Nasdaq, b

Channel resistance comes into play for S&P and Nasdaq

Image
Including channel resistance in charts can be a bit of a mixed blessing. On one hand, it gives an indication as to when sellers can be expected to make an appearance in a rally. On the other, it can force you out of a position right before a rally accelerates. The S&P is underperforming relative to the Russell 2000 ($IWM), and yesterday's doji made a picture perfect tag of channel resistance, that delivered with selling today.  If one was to look where buyers might come back, the 20-day MA is looking a good place to start; a bounce here would put a squeeze for a channel resistance breakout and an acceleration of the current rally. 

Rallies move into fresh air as Friday's bearishness is negated

Image
A bright start to the week has given bulls an important advantage, although trading volume remained light overall. Since the breakouts in early July I would be looking for a more substantial retest of breakout support than what we saw last week.  However, there is no guarantee we will see such a move. In the case of the Russell 2000 ($IWM), today's gain pushed beyond the tight trading of the last four days. Volume rised to register as accumulation, but in overall terms, today's volume was light.  Technicals are net bullish. I would like to see tight trading near the highs of today to consolidated the jump. 

Friday's selling ranks as distribution, but positives remain

Image
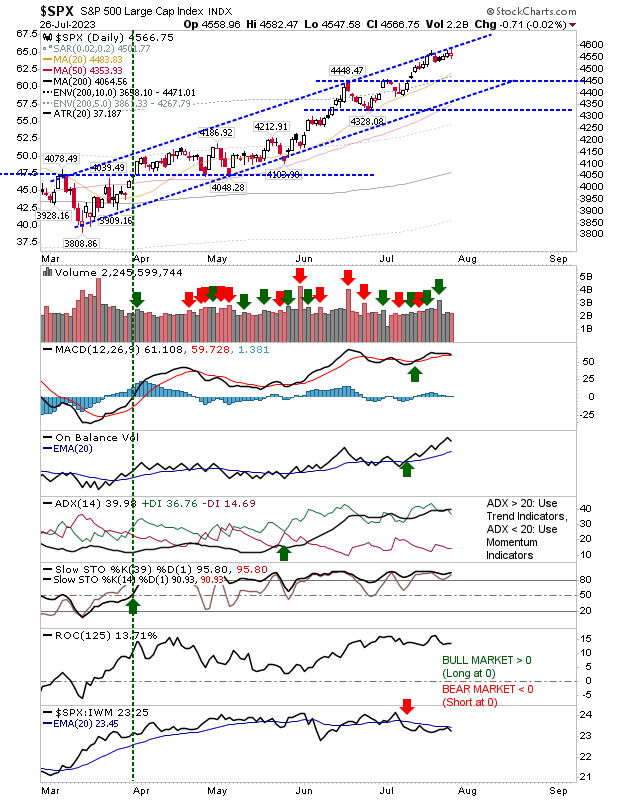
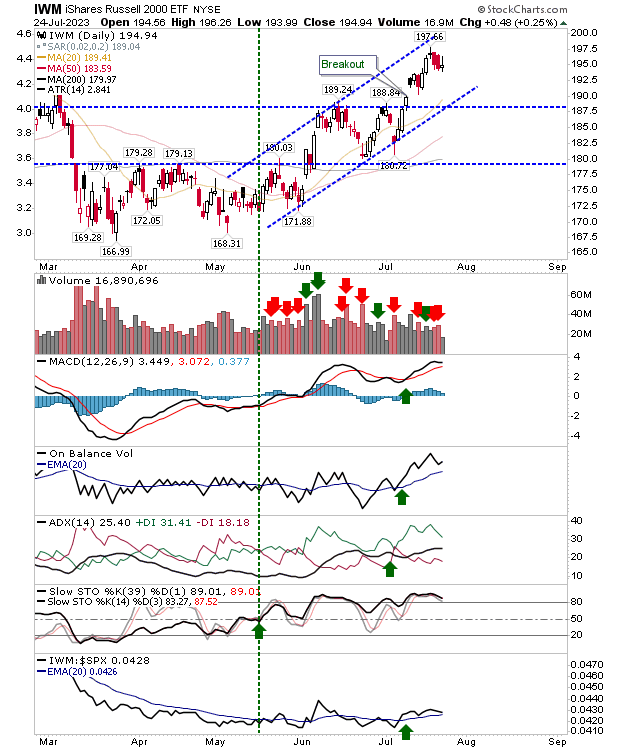
It was inevitable sellers would come in to pick at the breakout, and they did so with aplomb, but not before they left behind some bullish signs. Last Friday was not an options expiration day, so volume ranked as distribution, but no support level was challenged by the close of business. The biggest selling was found in the Russell 2000 ($IWM), but such action didn't reverse any of the bullish technical signals in the index. The Nasdaq and S&P experienced less selling than the Russell 2000, but the selling did rank as distirbution.  Friday's action could be considered a doji, and the indecision asscoiated with this candlestick could mark a reversal, but neither the Nasdaq or S&P are at resistance - so I would view this as a pause in the rally.  The S&P saw a new 'buy' trigger in the MACD, keeping lead technicals as net positive.  The Nasdaq also delivered on a MACD 'buy' as it runs inside its rising channel.  Technicals are in excellent s

S&P and Nasdaq follow Russell 2000 breakout

Image
The Russell 2000 made its move, but today it was the turn of the Nasdaq and S&P.  Technically, the breakouts for both of these indices occurred yesterday, but doji don't really qualify because of the implied indecision and potential topping aspects of this candlestick.  However, today's (small) white candlestick in these indices was enough to count the move as a breakout.  The MACD trigger 'buy' is an added bonus. 

Archive

Show more