Posts

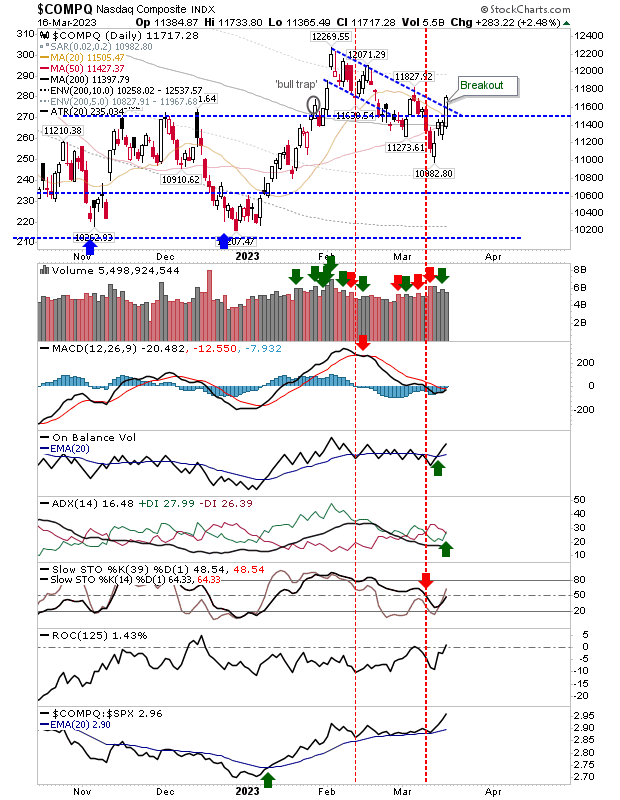
Indecisive gains, if there is such a thing...

Image
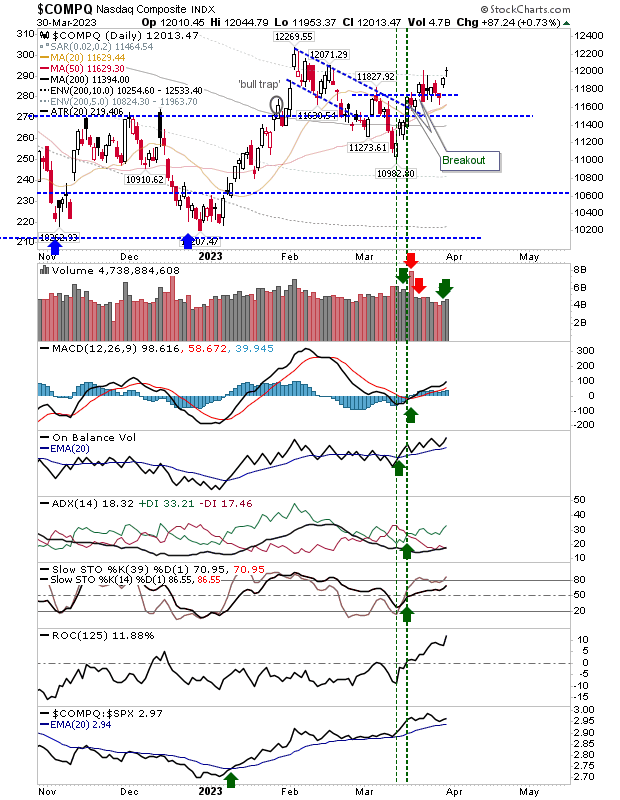
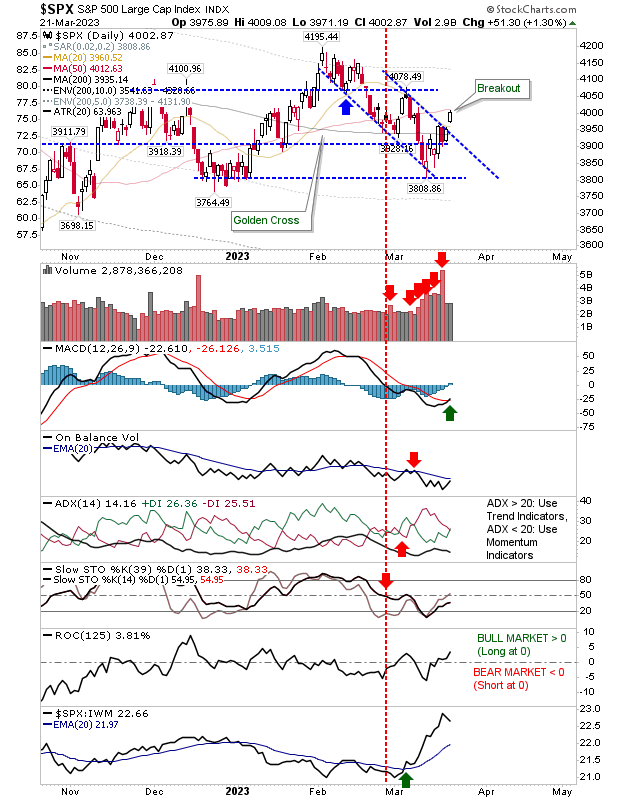
Buyers were able to drive gaps higher at the open, but couldn't build on the initial gains. The Nasdaq managed to make a new swing high for the March rally, but it could take a while before the February highs are challenged.  Technicals are net bullish, and more importantly, the index is outperforming the S&P.  It looks like risk can be measured against the 50-day MA.

Russell 2000 needs to bust out of its range

Image
It's getting a little dangerous for the growth stock index.  The Russell 2000 ($IWM) is experiencing an ever decreasing series of individual highs as it looks to defend December lows.  Technicals are net bearish, but there is a chance for a 'weak' buy below the bullish zero line.  Trading volume is a little light, but really, I want to see a solid white candlestick rather than the two indecisive candlesticks over the last couple of days, particularly as Friday's 'bullish' piercing pattern had promised more.  The March consolidation is not the best if you are of bullih persuasion. 

Wednesday's selling was tough, but Friday offers hope

Image
"Hope" is a bad word in trading, but markets are holding up better than I expected.  The Russell 2000 is the index to watch because of the import of growth stocks to secular bull markets, but also because it's the index closest to crashing.  Friday was an important day for the Russell 2000, as the index started with a gap down.  There was significant risk of a collapse, but buyers stepped in and managed to deliver a close above support.  This is key, because Small Caps closed above support as defined by candlestick real bodies. Buying volume was a little light, so no accumulation, but I would be okay if at some point in the coming week we did see some accumulation.  Technicals are net negative, and while Friday's price gain was good, there was no improvement in supporting technicals. 

Markets giveth, then taketh away

Image
Monday's action had looked to provide some security for bulls, but then bears came in with gusto and closed the day with bearish engulfing patterns for the Nasdaq and S&P, and a big red candlestick for the Russell 2000.  The Russell 2000 experienced the biggest sell off of lead indices. The substantial red candlestick came with higher volume distribution, at a time when it looked like the selling was done.  The index continued with its underperformance to the Nasdaq and S&P, so it looks like crash watch is back on.

S&P breakout adds to the earlier breakout in Nasdaq

Image
Friday was a sticky finish for markets, Monday managed to make back some of this lost ground, and today delivered a breakout in the S&P. I had talked over the weekend about the risk of a crash, particularly in the Russell 2000, but today's action in the S&P goes some way to averting this scenario.  The Russell 2000 is still in trouble, but there is reason for optimism in the S&P.  The gap move above resistance came with a new 'buy' trigger in the MACD, although other technicals remain bearish.

Friday's selling threatens major support in Russell 2000 (and maybe S&P too...)

Image
Tricky times for markets, but for the Russell 2000 in particular. Since the start of the Silicon Valley Bank crisis we have seen a rapid deterioration in the state of the markets, and the vulnerability for a crash, as crashes occur not from highs, but when markets are oversold - and that's where we are now. However, last summer's low is a low of consequence and import, so I would see any additional loss as a temporary loss that should quickly reverse and offer excellent buying opportunities for those willing to take the risk (as a long term investor).  Where it gets more questionable, is how far any such sell off/crash could go.  But before we get there, we need to see a loss of existing support.  For the Russell 2000 ($IWM), this is the $170 level. Selling volume surged last week in confirmed distribution and technicals are net bearish. Relative performance is also accelerating lower. 

Nasdaq manages to stage a breakout

Image
After a volatile few days, indices have managed to stage a recovery with some indices doing better than others. The Nasdaq managed to return above support, while breaking resistance from what had been a 'bull flag'.  Volume eased back despite the gain; not a great association given the extent of today's move higher. Play the resistance breakout, but we don't want to see an undercut of 11,500 support. 

Archive

Show more