Posts

A tick in the calendar as today's non-event keeps markets on track for breakouts
Image
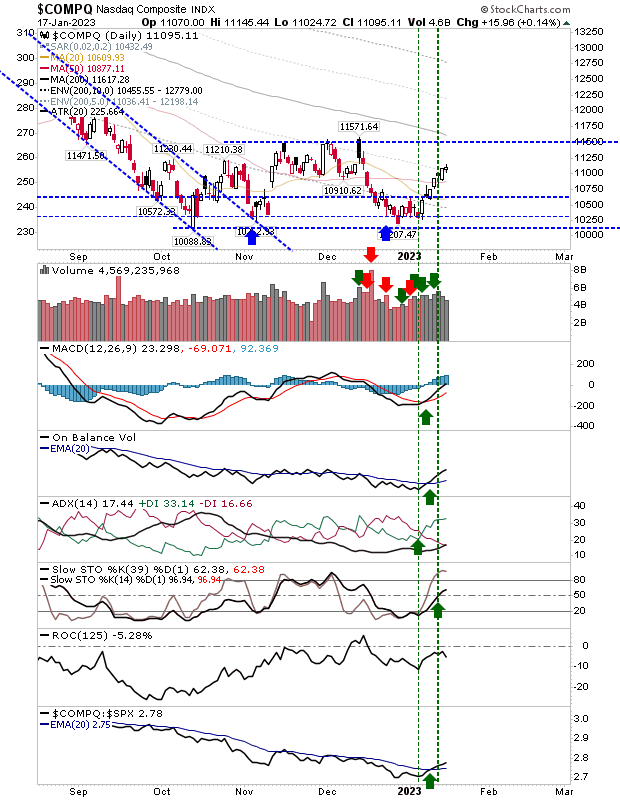
A pause in the Santa rally keeps things on track without confirming anything.  The Nasdaq had the best of the action by virtue of its modest close higher, but really, there wasn't much in it for any of the indices.  Volume was below Friday's, so no registered accumulation day, but it did at least add to the bullish trend in On-Balance-Volume.

Dow poised to breakout, Russell 2000 not far behind, S&P and Nasdaq gain ground.

Image
Markets edge towards a breakout in another day of buying.  Buying volume was down on Thursday, but indices are only a day or two away from significant breakouts. The Russell 2000 ($IWM) had made strong gains in relative performance since the middle of December and ticked nicely higher on Friday. The target breakout price is $188.70, although expect some pause at this price as the rally has gone six days without any give back. 

Markets are net bullish in technicals - Dow Jones ready to breakout

Image
A good day for markets left the S&P, Dow Jones Industrial Average, Nasdaq and Russell 2000 in a state of net bullish technical strength.  This development puts down a marker for an intermediate (or longer) term rally - lead by the Dow Jones Industrial Average. I don't normally cover the Dow Jones Index, but it is nicely set up to breakout with a solid cup-and-handle pattern above all lead moving averages and a modest (but confirmed) accumulation day.  The index could barely do more.  The only spoiler was the relative underperformance against the Nasdaq 100, but price action will always lead.

Edge gains help pull indices away from trading ranges.

Image
It was a modest gain, but significant in that Tuesday's it helped push the rallies into spike highs from Monday - helping to weaken the bearish implications of yesterday's action.  Volume was lighter, so there was no accumulation, but there was some technical improvement. For the S&P, there was the MACD trigger 'buy', as relative performance against the Russell 2000 took a nose dive.  The index is holding 50-day MA support and is well placed to challenge the 200-day MA. 

Friday's action looks good on paper, but trading ranges remain

Image
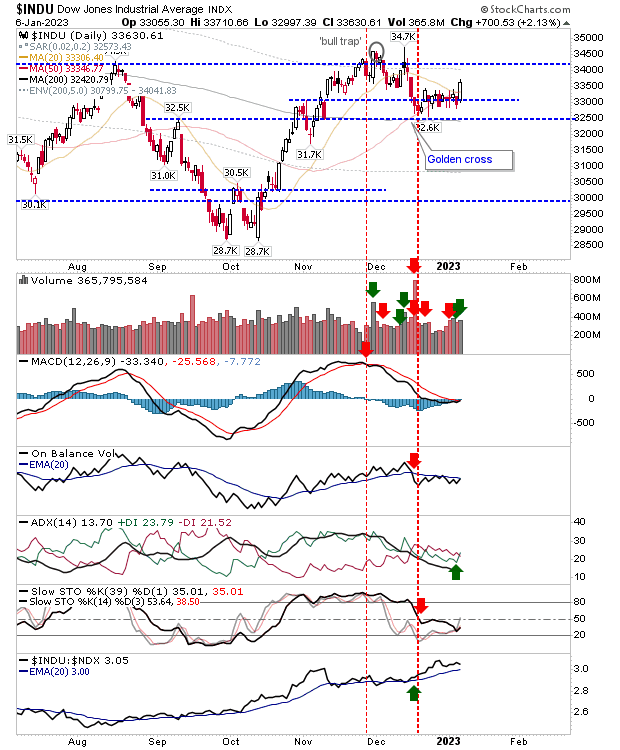
A healthy close to Friday's action saw confirmed accumuation across lead indices, but not all indices were able to escape the grasp of their trading ranges.  Best of the indices was the Dow Jones Industrials Average ($INDU).  It gained over 2% with a new ADX (trend) 'buy' trigger on higher volume accumulation, with new 'buy' triggers in the MACD and On-Balance-Volume in the works.  The only caveat is that momentum (slow stochastics) are in a bit of a no-mans land - I would want to see this cross the mid-line to restore bullish momentum. The Dow Jones is in the index best placed to drive new all-time highs and take other indices with it. 

Post-Covid New Year has a sluggish start for Markets.

Image
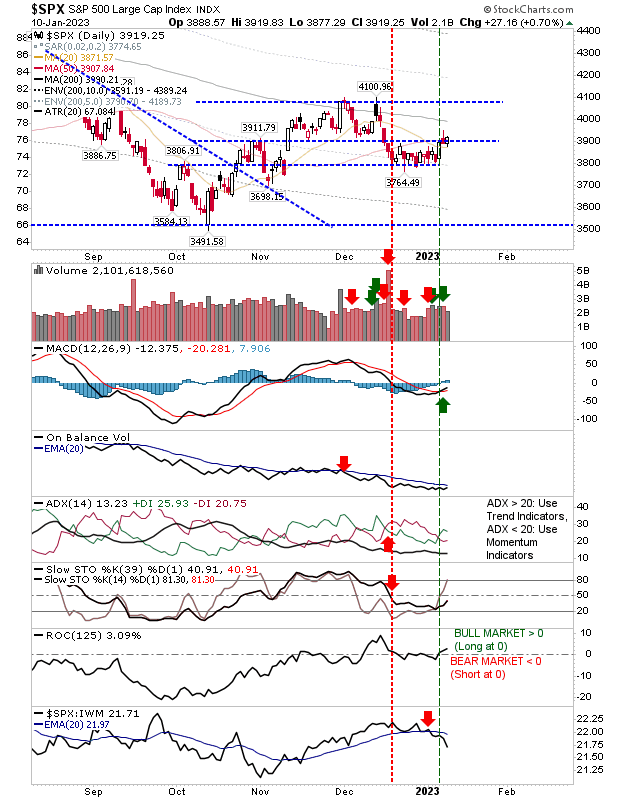
As a birthday treat, I finally grabbed a dose of Omicron, delivering enough fun and games to keep me low for the early part of the week.  The New Year is well underway - and the market - well, it hasn't done a whole lot since I last left it.  People have stopped believing in Santa, and market action was all a bit slushy, so what have we to look at.  The S&P is holding the support level defined back in the early October swing high.  Volume has picked up on the slow return of traders as On-Balance-Volume continues to trend downwards.  We have a switch back to the underperformance against the Russell 2000. Optimists might look to the upcoming MACD trigger 'buy'.  At this stage, given the length of the consolidation, and its compactness, it looks like one that will break lower. 

Bullish reversal candles in time for Santa

Image
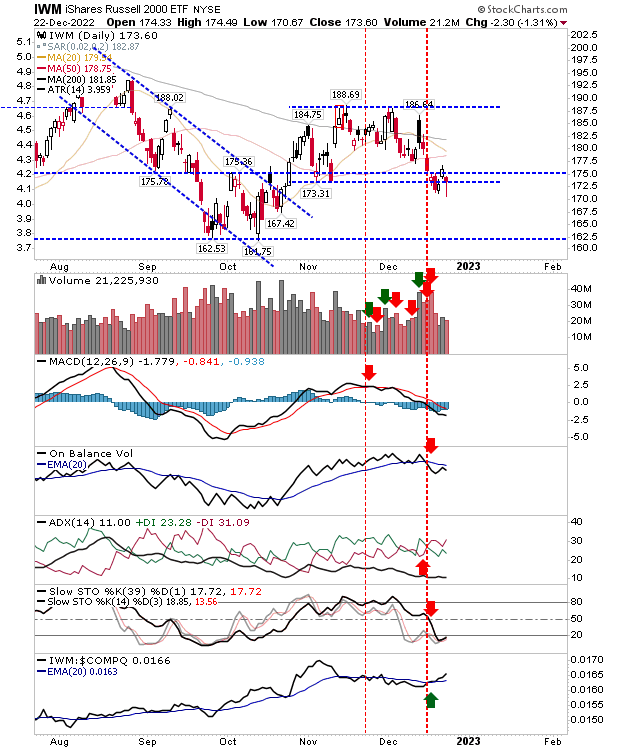
It has taken a while, but the 8-day decline has finally flashed reversal candlesticks across indices.  Lead indices finished with 'bullish' hammers with spike lows marking increased demand.  Indices are at or near support, strengthening the potential of the reversal.  The Russell 2000 ($IWM) had the longest spike low on oversold technicals.  The index has the additional benefit of outperforming the Nasdaq and gaining ground on the S&P.  Traders can measure risk:reward using a stop at the loss of today's low with a target of November's highs. 

Archive

Show more