Posts

Rallies Accelerate Without Volume

Image
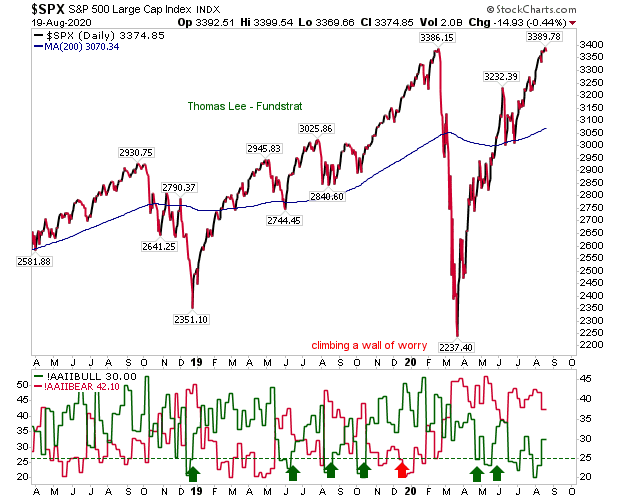
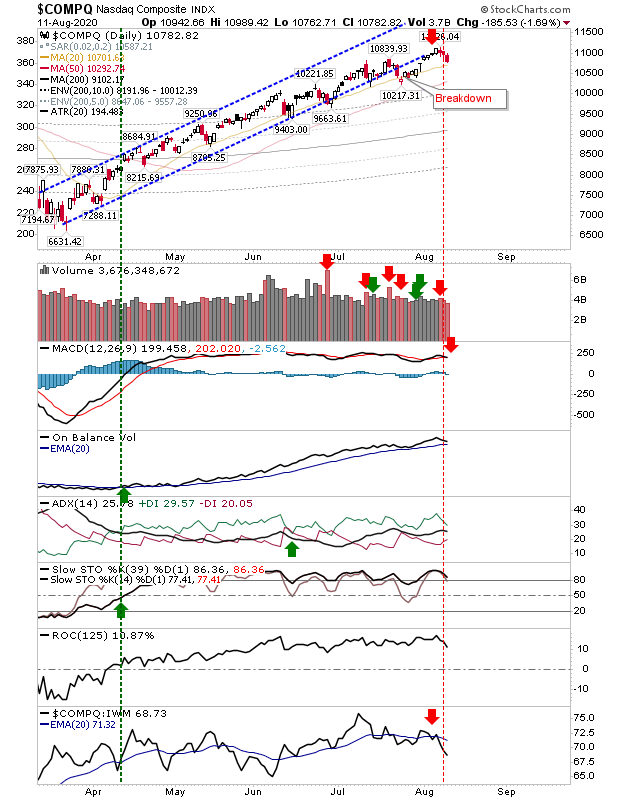
Hard to know what to make of today's action. For Large Cap and Tech Indices there was a pick up in the rate of buying, but the volume to go with the buying was below average - even allowing for holiday (Covid19 holiday) trading. The Russell 2000 didn't manage to post a gain but didn't suffer too much damage. The S&P has moved into the 15% zone and is close to the 10% range of historic overbought price relative to its 200-day MA dating back to 1950.  The last time it was this overbought was February 2020, and before that it was January 2018; both times soon followed by periods of downside (back to the 200-day MA at the very least). Supporting technicals, including relative performance to the Nasdaq and Russell 2000, are strongly moving in bulls favor so we have very little in the way of early warning that weakness is coming so we should pay attention to relative performance to the 200-day MA metric.

Dow Jones Gain

Image
It was left to Large Caps to do the heavy lifting today. The Dow Jones Index was today's winner as it added over 1% on heavy volume accumulation. The index is still experiencing relative underperformance to Tech indices, but the gain marks a new swing high and an opportunity for momentum traders to get involved with some more defensive stocks.

Hard To Get Excited As Rallies Continue

Image
Things tick along in markets with little fanfare; the Nasdaq and S&P both registered gains, but the Russell 2000 took a small loss - but not enough to reverse the breakout. The small loss in the Russell 2000 also came with registered distribution, but not overall volume was light - so probably not too damaging. To compound the weakness there were 'sell' triggers in the MACD and On-Balance-Volume to go with the ongoing underperformance of the index relative to both the S&P and Nasdaq. 

And the wait continues...

Image
A day of small losses but no real damage to the rallies. With the S&P joining the Nasdaq in erasing Covid losses, everyone is waiting for sellers to sweep in and kill this rally but they might be for a surprise. The American Association of Individual Investors sentiment is firmly in the bear column, which means bulls may be the one to benefit as it typically plays as a contrarian indicator.

Little change for indices from last week

Image
Markets are posting small gains which in themselves offer little, but over the course of days add up to a stealth rally. Indices remain above key moving averages, which runs in support of the market trend. Tags of 20-day and 50-day MAs have provided buyers an opportunity to buy the dips but for how long? The Nasdaq fell outside of its rising trendline in a slowing of this trend. The 20-day MA is still playing as support but it will take a test of the 50-day MA to assess how much real demand there is. One thing this stealth rally had me overlook was the overbought tracker - the index is in the 10% zone, which means the index has extended beyond 90% of prior price action relative to its 200-day MA dating back to 1971. So a top is closer than some might think. 

Indices Tick Over For Another Week

Image
The week passed with little change in lead indices. The Nasdaq is moving sideways after trading flat out of its five month rising price channel. The index is underperforming relative to the Russell 2000 with a 'sell' trigger in the MACD, but other technicals are bullish. Friday's narrow range day came with higher volume distribution but it was more of a neutral close to the week. It's anyone's game for next week.

Nasdaq Expands on Breakdown

Image
There was a small dose of trouble for indices as the Nasdaq pulled away from former channel support (turned resistance) with relative performance accelerating away from the Russell 2000. Selling volume was down on Monday, so no distribution day, which is a positive. Because of prior strength, the Nasdaq is only testing its 20-day MA - something it had successfully achieved in late July, but will it be able to repeat the feat again?

Archive

Show more