Posts

Russell 2000 Diverges From Nasdaq; But Breakout Holds

Image
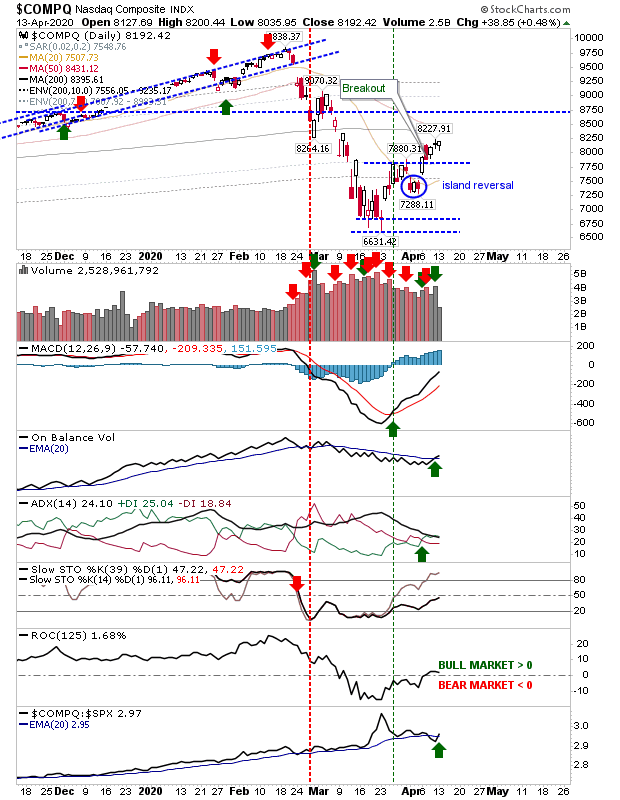
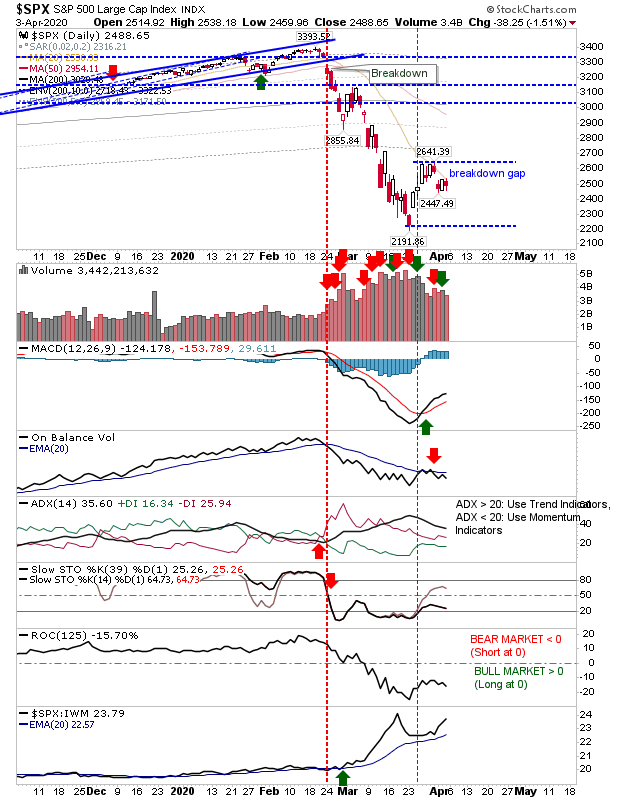
Some low key selling from indices other than the Nasdaq, but not enough damage to reverse the breakouts. Bulls still doing enough to keep the bounce intact. Starting with the positive, the Nasdaq finished a little higher with a bullish hammer and a relative out-performance advantage against the S&P; although the 'bullish hammer' is not a true hammer because momentum is not oversold.

Russell 2000 Breakout

Image
It started with the S&P but now the Russell 2000 ($IWM) has managed to follow suit with a breakout of its own. The move above $117 has come with a breakout gap, and has room to maneuver before it encounters resistance at its 50-day MA or the March breakdown gap.

S&P Confirms Breakout

Image
The S&P did a good job reversing yesterday's bearish cloud cover, clawing back all of yesterday's losses and remaining above breakout support. Technicals aren't all there yet; the ADX (+DI/-DI) joined the MACD on a 'buy' trigger, while Stochastics and OBV remained bearish.

Bullish Island Reversals

Image
Surprising action from markets with gap breakdowns switching instead to bullish island reversals. These reversals were also accompanied by breakouts for some indices which keeps the bounce going for a little bit longer.  Island reversal do need to come from oversold momentum indicators, and this is not the case here.  It's possible we have the low retest, but given the extent of the initial decline it will still be a while before indices pull themselves out of oversold conditions. The S&P almost registered a breakout, but technicals haven't improved enough to suggest we are there yet. While relative strength continued to improve, aside from the MACD we haven't seen too much improvement elsewhere.

Breakdown Gaps Remain, But Selling Doesn't Accelerate

Image
While Friday was a day for sellers, it didn't undercut the initial lows established by the breakdown gaps. While markets remain in a short period of stasis, given recent volatility, they are unlikely to remain there for long. Selling volume was down from Thursday's buying, but given the breakdown gaps haven't really been challenged, the expectation is that markets will continue lower as part of an initial retest of March lows. For the S&P, there is a well established MACD trigger 'buy', parlaying against a 'sell' trigger in On-Balance-Volume, but a fresh acceleration in relative performance against more speculative Small Caps.  What money is flowing to the market does appear to be going into more defensive Large Cap stocks.

Indices Enjoy Accumulation But Breakdown Gaps Remain

Image
The best thing about today was the higher volume buying, but the breakdown gaps established yesterday by the selling remain the same. However, markets have reversed in bulls favor in the short term but these gaps need to close soon if their bearish inference is not to be confirmed. The S&P finished with a bearish engulfing pattern but On-Balance-Volume hasn't yet signaled a 'buy' despite the higher volume buying.

Small Caps Remain Most Under Pressure From Sellers

Image
With a new month we have a fresh review of the monthly investor watch signals; the tables at the very end of this article show the current relationship of the indices to their 200-day MA. The S&P and Nasdaq are still in the 10% zone of historic weak action; the latter back to 1950 - the former to 1971. The Russell 2000 is still well inside the 1% of historic weak action and today's action confirmed this. The Russell 2000 took a near 7% loss and gapped down from its swing high; this gap - if it becomes a true breakdown gap - cannot close, so it does establish a risk:reward marker for shorts to work with and  a resistance line to define a sequence of higher highs when this turns into a bull market. The question now is whether it will test the March swing low or make a new higher low? To add to the misery, selling volume increased as new distribution was registered - again, one which points in favor of short trades.

Archive

Show more