Posts

Dow Leaves a 'Bull Trap'

Image
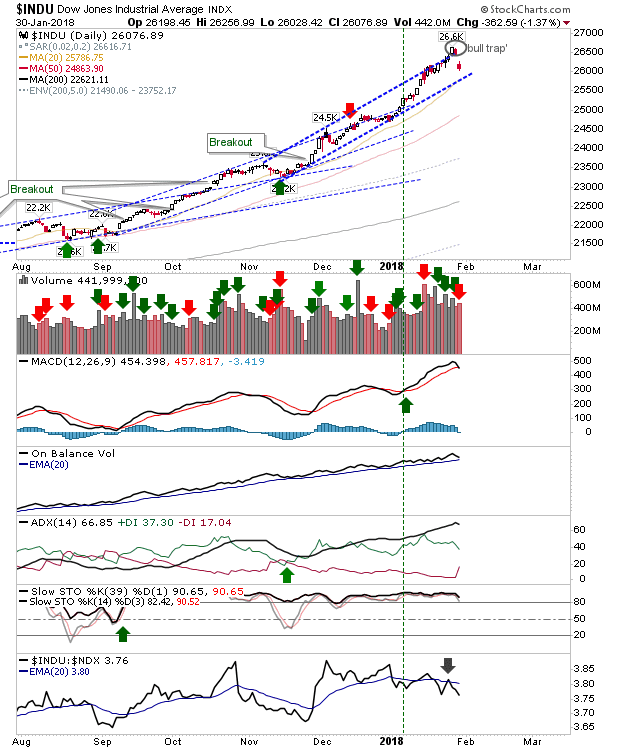
Two days of selling has finally put a stop to the accelerated gains from December but it should also provide an opportunity to shake the weak hands out of their positions and set up a more sustainable rally. The nascent breakout in the Dow has been undone by the fall back inside the prior channel, leaving in its wake a 'bull trap'. Shorts will use the 'bull trap' highs as a place for stops.  Typically, 'bull traps' from channel breakouts go all the way and drop out the other side - this would be a secondary shorting opportunity but we are not there yet.

S&P Rally Continues to Fire as Dow Breaks Out Again

Image
Another firm round of gains across all markets kept things buoyant. The Dow managed a fresh breakout from channel resistance on higher volume accumulation.  This has the look of yet another channel acceleration as the chance for a parabolic blowout increases.

Bearish Wedge in Russell 2000?

Image
It's a bit of a grasp given strength across markets but the Russell 2000 may be shaping a bearish wedge. There are three tags of resistance but it's rising support anchored by the two 'bear traps' which suggests a possible wedge. Today's bearish engulfing pattern also contributes.

Nasdaq Hits 15% Historic Price Action Highs as S&P Enters 10% Extreme Zone

Image
The Nasdaq joined the S&P at historic highs as it hit the 15% zone of historic price extremes (relative to its 200-day MA). The S&P went a step higher as it touched the 10% zone of historic highs; i.e. it trades at levels above 90% of historic price action dating back to 1950 - a sign there isn't much left to this rally. If it makes it to 2,874 it will be in the 5% zone, a zone last seen in February 2011.

S&P Keeps Marching Higher

Image
Last week saw the S&P hit the 15% of historic price action where it has been 10.7% or higher above its 200-day MA since 1950.  As of Friday, it's only 0.3% away from hitting the 10% of historic price action; i.e. over the last 68 years the S&P, 90% of historic action has been lower than where the index sits as of Friday's close - i.e. heavily overbought. This is time to be taking profits and/or selling covered calls on existing positions. Volume climbed to register accumulation as other supporting technicals give no indication of potential weakness - so those waiting for more upside don't have much to suggest this won't happen.

Short Covering Driving Gains in Semiconductors and Nasdaq 100

Image
The Nasdaq 100 breakout cleared channel resistance, the fifth significant breakout in four months. All technicals are posting new near-term highs which also meant the short generated on the tag of the rising channel is negated.

Russell 2000 Tags Resistance As S&P Breaks (Again!)

Image
I forgot to mention last week that the S&P has reached the "15% of Profit Take" zone of historical price action relative to the 200-day MA dating back to 1950. If it reaches 1,653 it will be in the 5% percentile of historic action - a 'strong sell' signal.  The price tag came with a fresh breakout from the channel; the second breakout in 2018.

Archive

Show more