S&P Keeps Marching Higher
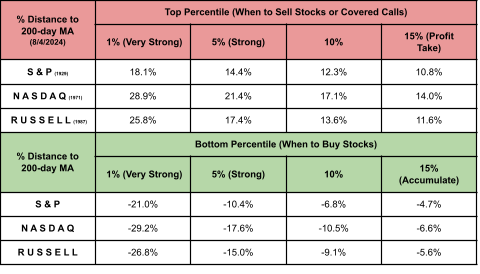
Last week saw the S&P hit the 15% of historic price action where it has been 10.7% or higher above its 200-day MA since 1950. As of Friday, it's only 0.3% away from hitting the 10% of historic price action; i.e. over the last 68 years the S&P, 90% of historic action has been lower than where the index sits as of Friday's close - i.e. heavily overbought. This is time to be taking profits and/or selling covered calls on existing positions. Volume climbed to register accumulation as other supporting technicals give no indication of potential weakness - so those waiting for more upside don't have much to suggest this won't happen.
The Nasdaq has gotten close to tagging its 15% zone of historic price action (like the S&P) but hasn't done so yet. Like the S&P, supporting technicals are good so there is no immediate point of concern.
The Russell 2000 was the only index offering a shorting opportunity but Friday's 1% gain has put pressure on this - although the channel has not been breached to the upside (the usual cover move). The Russell 2000 is still suffering from significant relative underperformance to its peers so it's still too early to see Friday's buying as anything but short covering.
The Semiconductor Index add a small amount but what's key here is that there hasn't been a 'bull trap' and the breakout from earlier during the week is holding. Buyers may get more upside out of this yet.
On the longer term charts, the relationship between Consumer Staples and Discretionary has reached new highs and is a long way from signaling a top since the 'fakedown' in 2016. This chart is a slow burner so there isn't too much to say about it now.
Nasdaq breadth metrics aren't near a top (or even a bearish divergence), despite the index approaching the 15% zone of historic rich action.
Meanwhile, commodities continue their slow recovery but are still trading at a deep discount to other asset types. Long term investors should be looking at commodity stocks for opportunities.
For this week, it will be about seeing how far the indices can push into historic price zone extremes. Price action may be 'hot' but there hasn't been any indication from supporting technicals to suggest a top has been reached.
You've now read my opinion, next read Douglas' blog.
I trade a small account on eToro, and invest using Ameritrade. If you would like to join me on eToro, register through the banner link and search for "fallond".
If you are new to spread betting, here is a guide on position size based on eToro's system.

---
Accepting KIVA gift certificates to help support the work on this blog. All certificates gifted are converted into loans for those who need the help more.
Follow Me on Twitter


Dr. Declan Fallon is a blogger who trades for fun on eToro and can be copied for free.
. I invest in my pension fund as a buy-and-hold.
The Nasdaq has gotten close to tagging its 15% zone of historic price action (like the S&P) but hasn't done so yet. Like the S&P, supporting technicals are good so there is no immediate point of concern.
The Russell 2000 was the only index offering a shorting opportunity but Friday's 1% gain has put pressure on this - although the channel has not been breached to the upside (the usual cover move). The Russell 2000 is still suffering from significant relative underperformance to its peers so it's still too early to see Friday's buying as anything but short covering.
The Semiconductor Index add a small amount but what's key here is that there hasn't been a 'bull trap' and the breakout from earlier during the week is holding. Buyers may get more upside out of this yet.
On the longer term charts, the relationship between Consumer Staples and Discretionary has reached new highs and is a long way from signaling a top since the 'fakedown' in 2016. This chart is a slow burner so there isn't too much to say about it now.
Nasdaq breadth metrics aren't near a top (or even a bearish divergence), despite the index approaching the 15% zone of historic rich action.
Meanwhile, commodities continue their slow recovery but are still trading at a deep discount to other asset types. Long term investors should be looking at commodity stocks for opportunities.
For this week, it will be about seeing how far the indices can push into historic price zone extremes. Price action may be 'hot' but there hasn't been any indication from supporting technicals to suggest a top has been reached.
You've now read my opinion, next read Douglas' blog.
I trade a small account on eToro, and invest using Ameritrade. If you would like to join me on eToro, register through the banner link and search for "fallond".
If you are new to spread betting, here is a guide on position size based on eToro's system.
---
Accepting KIVA gift certificates to help support the work on this blog. All certificates gifted are converted into loans for those who need the help more.
Follow Me on Twitter
Dr. Declan Fallon is a blogger who trades for fun on eToro and can be copied for free.
. I invest in my pension fund as a buy-and-hold.


