Posts

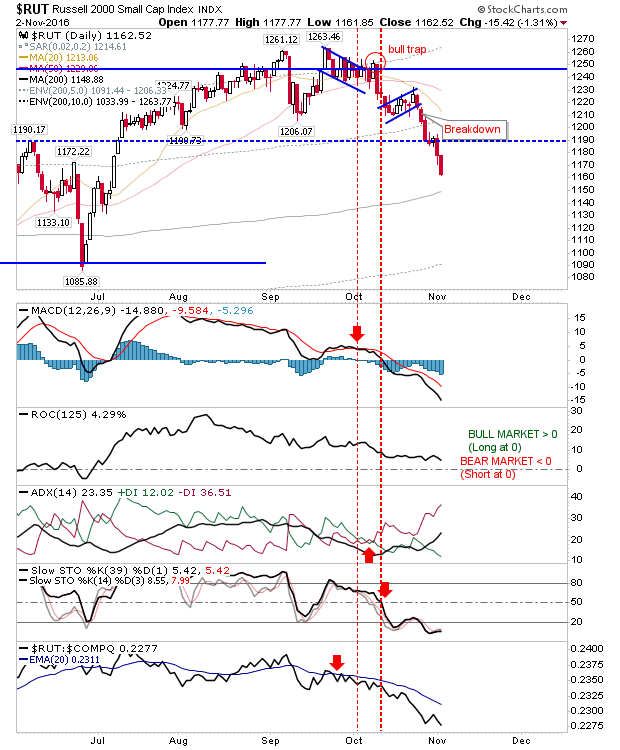
Stage Set for a Rally

Image
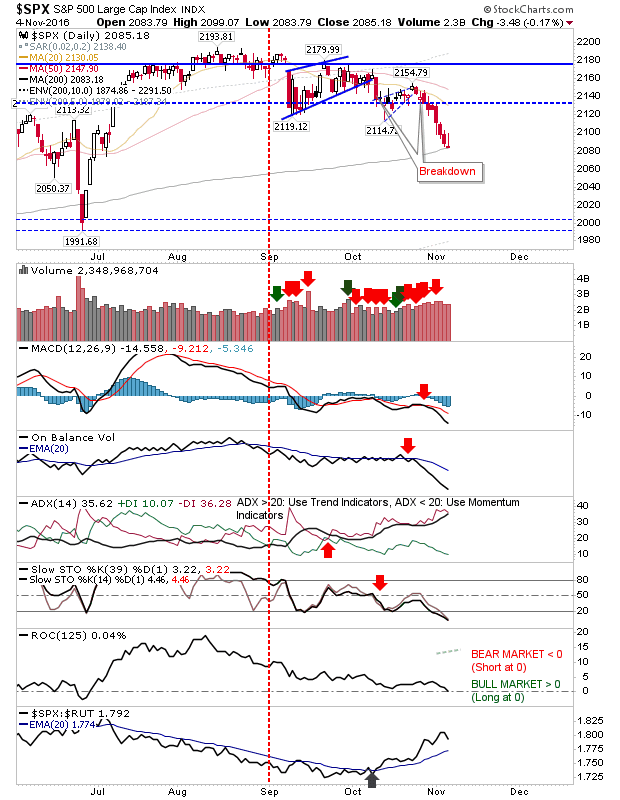
Friday delivered the tentative tests of the 200-day MA that markets had teased since breaking down from rising wedges. This has left markets in a good place for bulls to exploit on Monday. The S&P finished at the low of the day, but these 'inverse hammers' are typically viewed as bullish since while the S&P was unable to hang on to intraday gains by the close of business, there was no significant loss off the open price (i.e. no follow through down). Assuming there is no pre-gap lower on Monday (and even if there is, a buy just before the open might prove tempting), bulls could find themselves in a good position to trade into a probable Clinton victory.

Indices Approaching 200-day MA

Image
Yesterday's selling continued with Small Caps again taking the bulk of the heat. The Russell 2000 is fast approaching its 200-day MA which should be a buying opportunity.  An overshoot of this moving average in June lead to a 3-month rally, can lightning strike again? Technicals are already oversold, so there is little guidance on offer here.

Bears take a chunk out of the Market

Image
Not since the start of September have Bears been able to make an impression. For many indices, volume climbed to register a distribution day, adding to market troubles. There is no long term damage to markets as they remain within easy reach of all-time highs. Also, markets have reached oversold levels on intermediate and near term time frames, suggesting a bounce is likely soon. The S&P was able to claw back some of the losses from the intraday low, but it wasn't enough to avert a net bearish finish for the day. Technicals remain firmly negative.  The best thing about the index is the continued relative out-performance to its peers; when buyers reappear they are likely to buy into defensive Large Caps ahead of other indices. Watch for early strength - a two bar reversal would be an ideal play for Wednesday.

Small Caps Head South, Large Caps Drift Lower

Image
After failing to build a swing low at September's lows, the Russell 2000 went the other way..fast. The breakdown has moved out of the consolidation which has been in play since July, opening up for a retest of the June swing low at 1,086. Technicals are heavily oversold, so a reaction bounce, potentially from the open, would not be surprising.

Tech Hold Breakout,.but S&P Wedge Bound

Image
It was a mixed day for indices. Large Caps remain bound by wedge support/resistance, but Tech broke upside yesterday from similar wedges and held those breakout today. There was little change for the S&P over the last couple of days. The one technical change was the MACD trigger 'buy' as other technicals stayed on the bearish side.

More of the Same: Small Bearish Wedges

Image
Friday had bears rubbing their hands in glee as it finally looked like momentum was shifting their way, but bulls again stepped in to take markets back to their open price, and in some cases, higher. Volume did climb to count as distribution, but with the small price changes for these indices The S&P remains tightly bound to the rising wedge. Swing traders have the best chance to profit; market coiling action often leads to a directional trend - either a continuation down or a counter break higher, stop on the flip side. Technicals suggest a move lower.

Mini-Bearish Wedges in Lead Markets

Image
The last few days have seen little movement in key markets. The one potential development to look to resolve tomorrow or Monday are rising wedges in certain markets. The advantage bulls have is that if markets can push above wedge highs (which are close), shorts will be squeezed in a buying scramble. The S&P has a created a small, rising wedge off a larger rising wedge from September. The 20-day and 50-day MAs lend additional overhead resistance as does higher volume distribution for the index today (although the trading range for the day was very narrow).

Archive

Show more