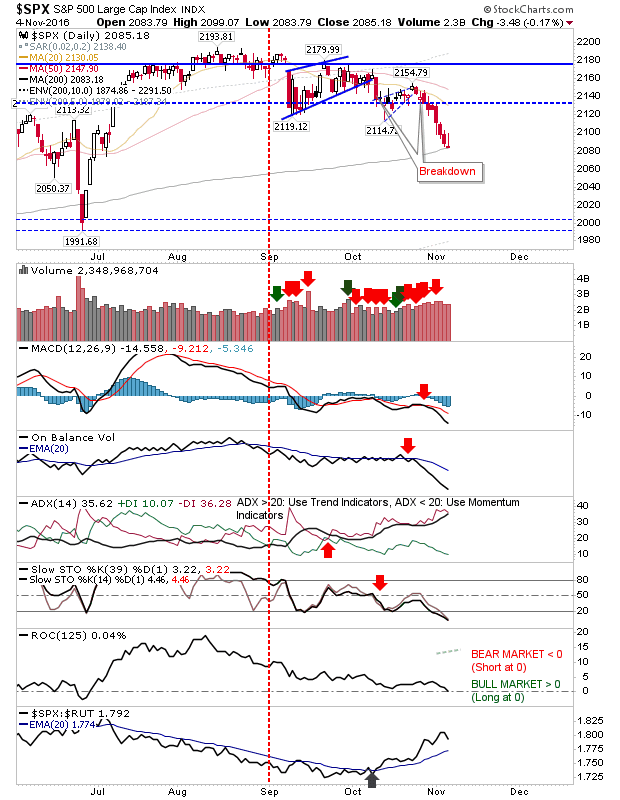
Friday delivered the tentative tests of the 200-day MA that markets had teased since breaking down from rising wedges. This has left markets in a good place for bulls to exploit on Monday.
The S&P finished at the low of the day, but these 'inverse hammers' are typically viewed as bullish since while the S&P was unable to hang on to intraday gains by the close of business, there was no significant loss off the open price (i.e. no follow through down). Assuming there is no pre-gap lower on Monday (and even if there is, a buy just before the open might prove tempting), bulls could find themselves in a good position to trade into a probable Clinton victory.
The Nasdaq didn't quite make it to its 200-day MA, but did finish on a similar 'inverse hammer' to that of the S&P. Technicals are oversold enough to suggest some bounce could emerge here on Monday - perhaps if polling doesn't show any further swing towards Trump. I don't expect volume to be heavy, not until Wednesday anyway.
The Russell 2000 was able to do a little better than the aforementioned indices. It was able to hang on to some of its Friday gains, and is within easy range of its 200-day MA. As a speculative index it's prone to much sharper swings than its Large Caps cousin. Don't be surprised if it mounts a July-August style rally from here.
The longer term picture has become a little more mixed, which is an improvement on what had been a quite bearish outlook.
The relationship between consumer discretionary and consumer staples is still in the bear camp and has remained remarkably static despite the losses of recent days. I would lie to see a drop back to the 1:1 relationship which marked the lows of 2000 and 2009; things still look too rich here.
However, the relationship between the Dow Jones Industrial average and Dow Transports has delivered a breakout and suggests improving economic conditions. Technicals have also picked up and delivered new swing highs for the past two years. The ratio is now up against previous channel resistance so some stalling in the relationship can be expected.
Finally, Nasdaq breadth is in firm decline. The Percentage of Nasdaq Stocks above 50-day MA is near oversold and at a point where rallies frequently emerge; strong rallies require oversold conditions in the Percentage of Nasdaq Stocks above the 200-day MA, Bullish Percents, and Summation Index, but a trade worthy rally is likely only days away.
Bulls - prepare for a rally. Shorts, time to take profits and maybe leave a little on the table in case Trump wins...
You've now read my opinion, next read
Douglas' blog.
I trade a small account on eToro, and invest using Ameritrade. If you would like to
join me on eToro, register through the banner link and search for "fallond".
If you are
new to spread betting, here is a guide on position size based on eToro's system.

---
Accepting KIVA gift certificates to help support the work on this blog. All certificates gifted are
converted into loans for those who need the help more.
Follow Me on Twitter
Dr. Declan Fallon is the Senior Market Technician for
ChartDNA.com, and Product Development Manager for
FirstDerivatives.com. I also trade on
eToro and can be copied for free.