Posts

Small Caps Head South, Large Caps Drift Lower

Image
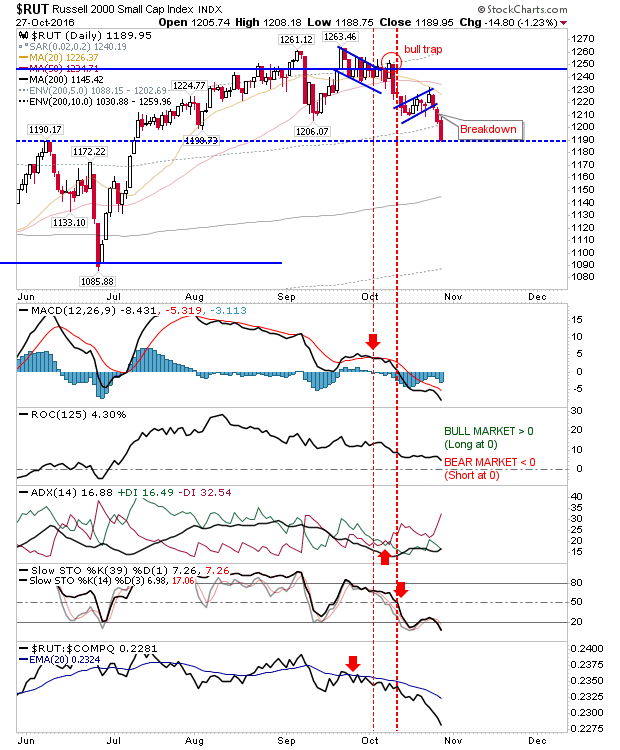
After failing to build a swing low at September's lows, the Russell 2000 went the other way..fast. The breakdown has moved out of the consolidation which has been in play since July, opening up for a retest of the June swing low at 1,086. Technicals are heavily oversold, so a reaction bounce, potentially from the open, would not be surprising.

Tech Hold Breakout,.but S&P Wedge Bound

Image
It was a mixed day for indices. Large Caps remain bound by wedge support/resistance, but Tech broke upside yesterday from similar wedges and held those breakout today. There was little change for the S&P over the last couple of days. The one technical change was the MACD trigger 'buy' as other technicals stayed on the bearish side.

More of the Same: Small Bearish Wedges

Image
Friday had bears rubbing their hands in glee as it finally looked like momentum was shifting their way, but bulls again stepped in to take markets back to their open price, and in some cases, higher. Volume did climb to count as distribution, but with the small price changes for these indices The S&P remains tightly bound to the rising wedge. Swing traders have the best chance to profit; market coiling action often leads to a directional trend - either a continuation down or a counter break higher, stop on the flip side. Technicals suggest a move lower.

Mini-Bearish Wedges in Lead Markets

Image
The last few days have seen little movement in key markets. The one potential development to look to resolve tomorrow or Monday are rising wedges in certain markets. The advantage bulls have is that if markets can push above wedge highs (which are close), shorts will be squeezed in a buying scramble. The S&P has a created a small, rising wedge off a larger rising wedge from September. The 20-day and 50-day MAs lend additional overhead resistance as does higher volume distribution for the index today (although the trading range for the day was very narrow).

Neutral Day for Indices

Image
Markets were unable to build on premarket gains, but did manage to finish the day where they started. The S&P closed with a narrow range doji, a doji which finished below Friday's bearish black candlestick. The pattern of the last five days is playing more in bears favour, but with support around 2,115 holding there is still a chance a broad swing low is in play; confirmation comes on a move above 2,160. Trading volume sided with bulls on a confirmed accumulation day.

Late Selling Leaves Markets at a Crossroads.

Image
The follow through from Thursday's buying burned out after the first hour of Friday's trading and Friday closed back at Thursday's close. Where Thursday's action had set up for upside follow through, Friday's 'inverse hammer' is offering the reverse.  The question is how strong the respective buying and selling which created the spikes from Thursday and Friday are? Monday is likely to start with a test of Thursday's buying. What happens after the first half hour of trading will set the tone for the rest of the day. The S&P is trading below 20-day and 50-day MAs. Thursday's selling was greater than Friday's buying which is another tick in the bear column. Technicals are all negative. The only positive was the relative out performance of the index to the Russell 2000.

Sellers Hit Out

Image
Today had the look of a decisive break down, but the last such breakdown from September's Brexit vote had a similar guise, but it failed to follow through. Volume climbed to register as another distribution day, the second (third for the S&P) such day since the last accumulation day. Tomorrow could be the decider, but it needs to break down right from the open - otherwise the agony will continue. The S&P is back showing net bearish technicals. However, the index continues to outperform the Russell 2000.

Archive

Show more