Posts

Daily Market Commentary: Vacation Trading

Image
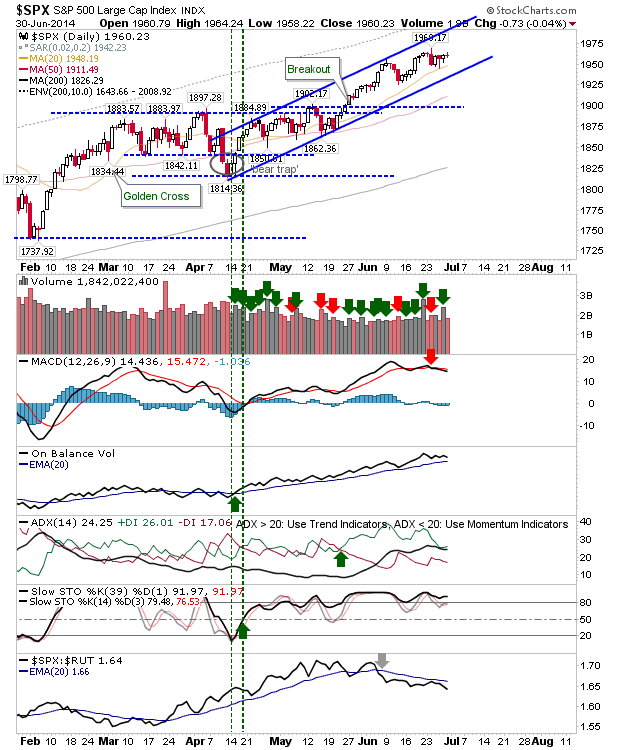
Not much to write about. The S&P did nothing more but offer swing traders a nice narrow intraday range to trade against.

Daily Market Commentary: Nasdaq Breakout II

Image
There was only one index at the races on Friday. Strong volume action, and the close above 'Head' resistance, suggests the Nasdaq breakout has finally taken. The 'Bull Trap' hasn't totally been negated, but Friday's action was a big dent in it.

Daily Market Commentary: Bull Comeback

Image
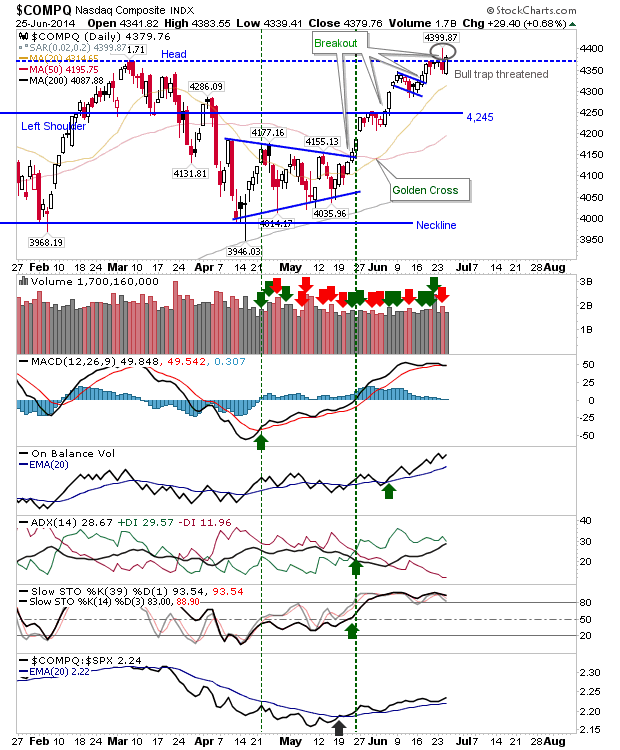
Well, that selling didn't last long. Buyers didn't even wait for tests of nearby moving averages before buying - they just jumped in from the open and didn't look back. The Nasdaq may have done enough to trigger a breakout, although the spike high at 4,399 has the potential to play as resistance.  Given the way the MACD is going, I suspect we are going to get a 'sell' trigger here. This is not to day bulls can't keep this going, but I think there needs to be a greater shake of weak hands from their positions to get a break of 4,400 to hold.

Daily Market Commentary: Distribution and Possible Bull Trap in Nasdaq

Image
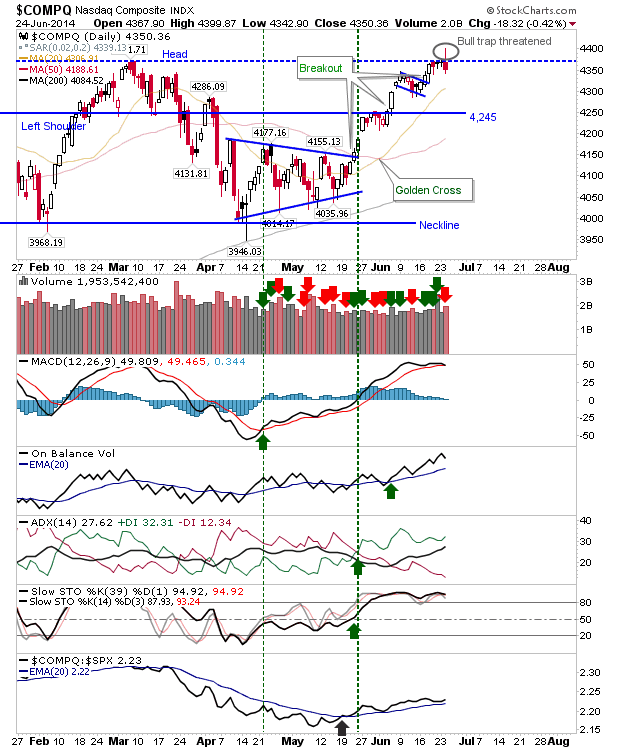
Sellers had to return at some point, and Tuesday was the day they paid a visit. I was too consumed with Suarez's fine dining skills to do an update last night, but given the day ranked as a distribution day it's worth passing comment. The most important action was found in the Nasdaq.  The index had looked to comfortably break past resistance, only to see it finish below this resistance. A classic 'bull trap' requires a close above, then below resistance, but Tuesday's action was more a plain rejection of the breakout level as a support zone.  The 'inverted hammer' on overbought short and intermediate term stochastics is a possible short entry with a break of 4,342 and an initial stop above 4,400. If going short, look to move the stop to around 4,369 on the first close below 4,342.
Sectorbreadth Analysis: Utilities and Energy Leading

Image
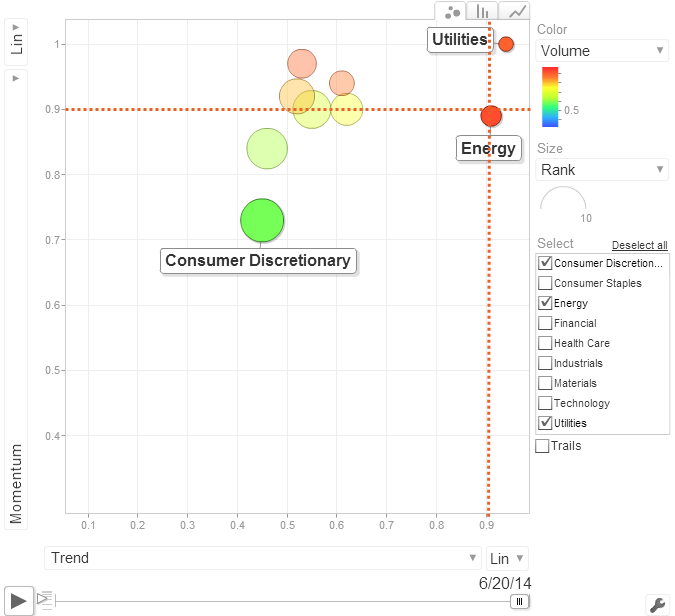
The summer rally has proven to be a boon for Energy and Utility stocks. According to my #sectorbreadth analysis, both Utilities ($XLU) and Energy ($XLE) are in covered call 'sell' territory, with Momentum, Trend and Volume indicators all above 90% bullish territory.  The September $44 strike call for $XLU traded at $0.65, and the September $102 strike call for $XLE at $2.20. The only sector cut from the pack is Consumer Discretionary ($XLY). While not in strong buy territory (I like to see all my breadth indicators below 10% for that), it may offer itself as a bargain bin opportunity for the summer on rotation out of overheated Energy and Utility stocks. You can access the interactive  sectorbreadth chart here .

Daily Market Commentary: Still Waiting on Nasdaq Breakout

Image
Ditto the weekend's comments. Some very tight action didn't change the outlook, although this narrowing of the intraday range will increase the reaction response when it breaks. The Nasdaq is either going to break out big or fall hard down; the breakout is looking more likely. A hard fall wouldn't last long as buyers would step in at 20-day MA and 4,245 support.

Daily Market Commentary: Watch for Nasdaq Breakout

Image
Lots of buying volume on Friday, although only small gains to match. The Nasdaq is best poised to advance on Monday given it lies just shy of resistance. The narrow range day also offers itself as a swing trade opportunity (with a stop on the flip side).  Trend direction suggests this will push higher, becoming a nail in the coffin to what had looked like a (complex) bearish head-and-shoulder reversal.

Archive

Show more