Posts

Daily Market Commentary: S&P 'Bull Trap' Intact

Image
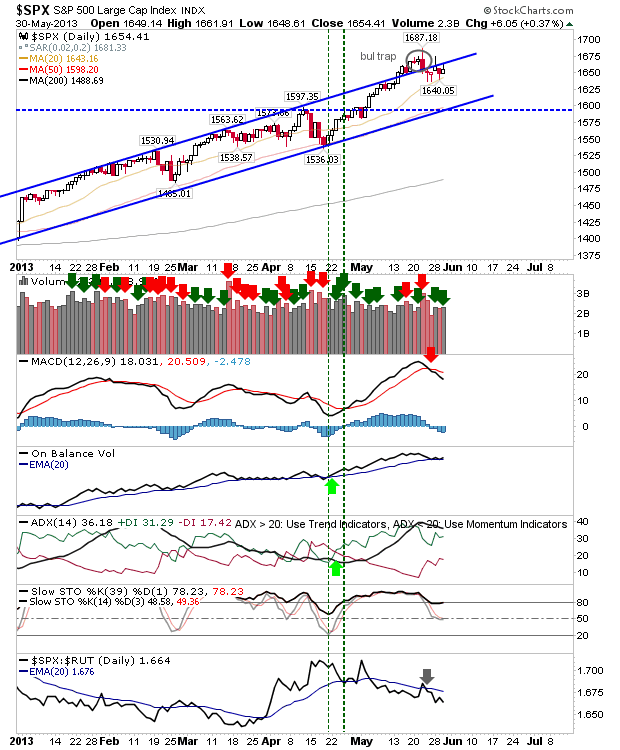
Despite missing a couple of days of action, the 'Bull Trap' which emerged in the S&P last week was still in play by today's close.  The two attempts at a rally in the past few days were rebuffed by the close: 1,687 is looking increasingly like a swing high top, and a good place to measure risk:reward if looking to go short.  The MACD has already triggered a 'sell'.

Weekly Market Commentary: (Another) Reversal From 52-Week Highs

Image
Last week, the number of 52-week Highs / Lows in the Nasdaq and NYSE flashed a new peak and reversed by weeks end. The peak in the NYSE New Highs / Lows was more prominent than the Nasdaq, although the last peak didn't result in a consolidation/decline. However, the chances are high that this peak will lead to a consolidation/decline, and this will remain in play until the next swing low (peak in 52-week Lows). Taking Profits should be the focus until the worst of the decline plays out.

Daily Market Commentary: S&P Bull Trap

Image
Today's losses were small, but enough to leave a 'Bull Trap' in the S&P. It was the only real action of note on the day.  Lower volume kept this from being a distribution day. The S&P came close to a test of the 20-day MA with a pending bear cross in the MACD and On-Balance-Volume. There was also a relative shift against the Russell 2000, which is better news for bulls as defense of Small Caps outweighed that of Large Caps.

Daily Market Commentary: Nasdaq Breaks Support

Image
It has taken over a month for sellers to mount a high volume challenge, but today was one such day.  In terms of total volume, it was one of the worst days for 2013. And in the context of the rally, it offers a sign for a potential swing high, but doesn't break the larger bullish trend - it will take much more selling to do that. The Nasdaq did lose the tightly ascending support line established from the April swing low.  A move to the 20-day MA looks most likely.

Daily Market Commentary: Small Gain Accumulation

Image
The gains were small.  The volume greater.  The rally ticks along.  There is little more to say than that...

Daily Market Commentary: Low Volume Losses

Image
The mini-rally started in mid-April continued to rule the roost. Today's low volume losses continued with the trend which has supported the rally: namely high volume gains, and low volume losses. The S&P sits 12% above its 200-day MA, which is unusually high. Although the S&P has managed to rally to 20% above its 200-day MA; typically this is done after a major low, and not at the latter stages of an advance. Neither action in the indices or supporting technicals suggest this rally is about to end soon.

Stock Picks: $AMBA, $VECO, $CREE, $FTK, $MW, $CCC, $BYI

Image
The following stock picks were reviewed in the links provided in the symbol: Ambarella : AMBA Veeco Instruments : ( VECO ) Cree : ( CREE ) Flotek Industries ( FTK ) Men's Wearhouse ( MW ) Calgon Carbon ( CCC ) Bally Technologies ( BYI ) Follow Me on Twitter Dr. Declan Fallon is the Senior Market Technician and Community Director for Zignals.com . You can read what others are saying about Zignals on Investimonials.com . JOIN ZIGNALS TODAY - IT'S FREE!

Archive

Show more