Posts

Daily Market Commentary: Sellers Emerge

Image
Today was a bit of a seller's tease. It was a clear win on the part of bears, but volume was light. Bernanke's comments tomorrow may inject the volume which was missing today. The most significant loss came in the semiconductor index.  It had been loitering around 200-day MA / 396 support, both of which were lost today. It has fallen back to breakout support, which is a last line of defense before the 50-day MA. Technicals suggest there is more downside to come. Also hurting was the Russell 2000 as it reversed against resistance. However, it finished close to the 20-day MA with the 50-day MA and 795 support nearby.  A further pullback - especially if it made it back to the angled trendline connecting the swing lows of June and July - could be an interesting long play for a push above 820. The Dow is offering one such trendline long play.  The rising wedge is bearish, but if there is a bounce it should happen from Friday's open. But in the bearish camp

Daily Market Commentary: Holiday Trading Continues

Image
There is only a couple vacation days left for August and this continues to be reflected in trading volume. The S&P continues to hold 20-day SMA support with a third doji in a row. The semiconductor index is holding horizontal support at 396 and its 20-day MA. The past five days have seen some very tight trading, so a big response can be expected soon.  Will Monday be the day this breaks the malaise? The Russell 2000 is the index most likely to break first. It is carefully poised on resistance and may make its move as soon as tomorrow. The one index to show a technical weakness was the Nasdaq 100 with its 'sell' trigger in the MACD.  However, the index itself remains above channel resistance and hasn't shown any price weakness. Not expecting much from tomorrow given the volume. --- Follow Me on Twitter Dr. Declan Fallon is the Senior Market Technician and Community Director for Zignals.com . I offer a range of stock trading strategies for gl

Daily Market Commentary: More of the Same

Image
In an extension of yesterday's lackluster action markets traded in a relatively tight range.  The Russell 2000 got the best of the day's action, adding nearly 0.5% in an attempt a push into overhead resistance around 820. Tech averages also gained, finishing slightly higher, but on light volume. The semiconductor index is trading at dual support of the 20-day MA and horizontal support of 396, a good place for a long trade.  A push higher in the semiconductor index will help long-side positions in the Nasdaq and Nasdaq 100. The S&P was able to hold its 20-day MA but with a new bearish cross in on-balance-volume.  The index is trading in the middle of a rising channel and could go either way. Again, bulls should stick to Tech and the Semiconductor Index.  Bears can look for a break in the 20-day MA of S&P - although it too currently offers a long side opportunity at this average. --- Follow Me on Twitter Dr. Declan Fallon is the Senior Market

Fluidigm ($FLDM) Flying?

My latest Motley Fool post on Fluidigm is available here . Other Motley Fool posts of mine can be found on the RSS feed here.

Daily Market Commentary: Low Key Day

Image
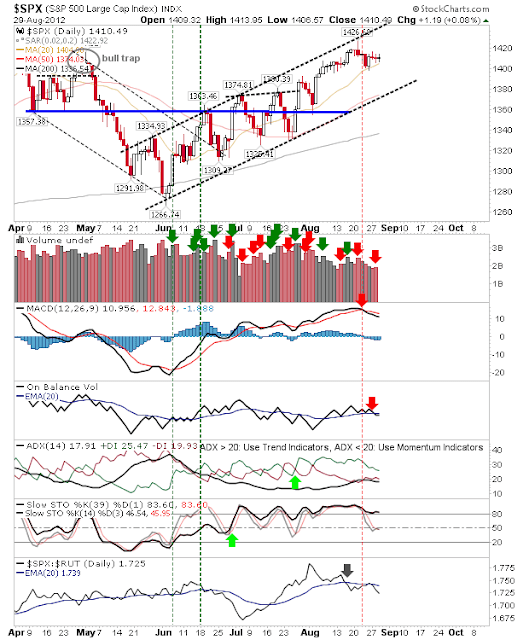
It felt like the Bank Holiday in the U.K. seeped into Monday's U.S. trading. Markets experienced small losses on light volume.  The only exception was the Nasdaq which edged a tiny gain on higher volume accumulation, but it didn't change anything with respect to the market making a new high (or low). The S&P didn't do much, but what it didn't do is more interesting.  The 20-day MA is only a few points away and if it breaks there is a big gap down to the 50-day MA and rising channel support. The Russell 2000 was nondescript. The 820-826 zone is defining the index and currently is resistance. Indices still look like they want to push higher.  If there is a break lower, the S&P will be the index likely to suffer most (given the gap between 20-day and 50-day MAs). --- Follow Me on Twitter Dr. Declan Fallon is the Senior Market Technician and Community Director for Zignals.com . I offer a range of stock trading strategies for global markets w

Weekly Market Commentary: Weak(ish) Finish

Image
Friday's rally did enough to take the sting off the weekly close. The Nasdaq was the most resilient, shedding just a handful on points by Friday's finish.  Technicals held firm and are net bullish. Despite the slight decline in the parent Nasdaq, the Nasdaq Summation Index and Nasdaq Bullish Percents were able to close slightly higher, but the Percentage of Nasdaq Stocks above the 50-day MA fell. The Russell 2000 took the biggest hit on the week as it was repelled off 825, but the June rally remains in play. I have redrawn channel support to account for the latest rally. The S&P finished the week down -0.5% and just shy of a new high. However, the index held 1,400 support while it rides former channel support turned resistance. Look for a new multi-year high next week. Next week probably still offers enough of an edge for bulls. The Nasdaq is the leading indiex, closely followed by the S&P.  Small Caps are lagging and this is likely to continue while

Daily Market Commentary: Light Volume Selling

Image
Selling was focused in Large and Small Caps, but Tech Stocks were relatively immune. The S&P fell back to its 20-day MA with a MACD trigger 'sell' to accompany the selling. The next step is rising channel support. The Nasdaq still has room to run to support. Small Caps also have room to run to support, but continue to sharply underperform relative to Technology.  However, Small Caps do slightly better against Large Caps. The Nasdaq 100 sits at an interesting juncture, the sell off has taken the index down to former channel resistance which offers a long side opportunity. A day trade long opportunity may be available for the Nasdaq 100 at the channel line and the S&P 20-day MA. --- Follow Me on Twitter Dr. Declan Fallon is the Senior Market Technician and Community Director for Zignals.com . I offer a range of stock trading strategies for global markets which can be Previewed for Free with delayed trade signals. You can also view the

Archive

Show more