Posts

Daily Market Commentary: Stop the Rot?

Image
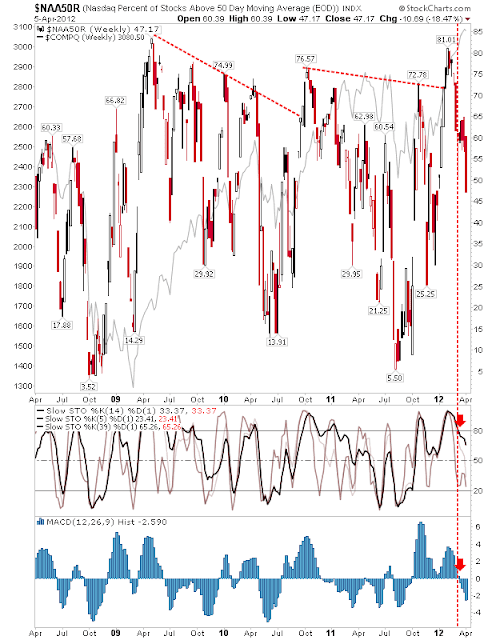
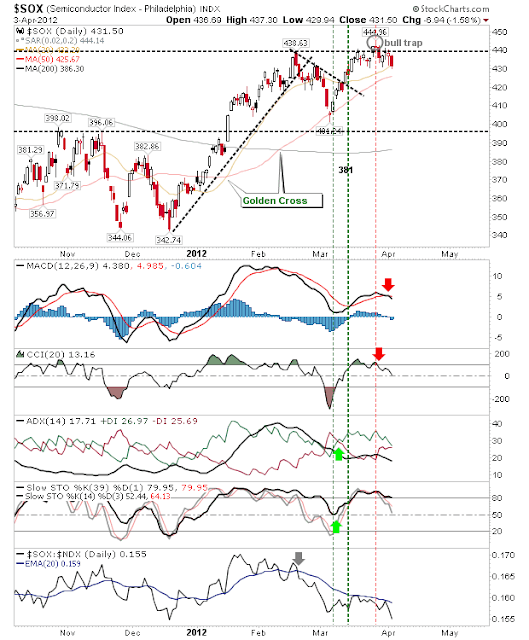
Yesterday's action was the first sign of concerted selling for the December-April rally, which meant today was little more than a breather. Whether bulls step in to build a swing low remains to be seen, but market breadth does offer scope for opportunity. The Nasdaq Bullish Percents are in overbought territory, but technicals are approaching (or have indeed exceeded) the swing lows defined by the December bottom. The Percentage of Nasdaq Stocks above the 50-day MA has reached a swing low and technicals look to support this. While the Nasdaq Summation Index is caught in the middle; technicals are oversold but the parent breadth measure is closer to overbought than oversold. If breadth indicators are marking a low, it's a swing low of a larger rally.  The presence of the 50-day MA offers another reason to be a buyer. What may hold the Nasdaq back is the semiconductor index; it's trading well below its 50-day MA. The Russell 2000 is also keeping

Daily Market Commentary: Significant Distribution

Image
The low key selling of recent days gave way to more earnest profit taking as indices saw support breached. The S&P made a clean slice of 1,376 and 50-day MA support as technicals turned net bearish.  Should the decline make it below 1,340 it will create a new swing low for the November-March rally and likely start a sideways consolidation pattern (ending the rally). The Nasdaq took a slightly heavier hit that the S&P, but it was able to hold 50-day MA and breakout support. While technicals weakened they haven't turned net bearish. The Russell 2000 took the biggest hit with a -2.40% hit. The index had long since said goodbye to its March breakout and 50-day MA.  The declines logical conclusion is a test of its 200-day MA, although technicals are close to oversold.  Today's low edges a new swing low, although a sideways consolidation would be favoured. It has been almost a month since selling volume was as great as it was today. The good news for bulls is

Daily Market Commentary: S&P Breakdown

Image
The S&P finally cracked below rising trendline support, but did so on light volume and remained above its 50-day MA. Technical weakness expanded, but the index is not net bearish - yet. The Nasdaq gave up 20-day MA support, but still has room to run to its 50-day MA. The relationship between the Nasdaq Bullish Percents and the Percentage of Nasdaq Stocks above the 50-day MA is reaching a swing high.   The last such peak in November 2011 marked the swing low for the Nasdaq; will it again prove so this time? Small Caps are in the most trouble; the index turned net bearish as the 50-day MA was undercut. While the Dow was left with the makings of a 'bull trap' So while the indices look to be only beginning their period of weakness there is enough to suggest a swing low is in place in the Nasdaq, although my sectorbreadth studies suggest further downside is required to confirm a bottom is in place. ---- Follow Me on Twitter Dr. Declan Fallon i

Weekly Market Commentary: Nasdaq Breadth Breaks

Image
Indices took their loses but the real hit was to market breadth. The Percentage of Nasdaq Stocks above the 50-day MA dropped sharply from 60% to 47%.  The potential swing low was knocked out, although it could be a couple of weeks before the impacts on the parent Nasdaq are felt (as was the case in early 2011). However, the Nasdaq Bullish Percents held gains despite the losses in the Percentage of Nasdaq Stocks above the 50-day MA. It still looks like an extended swing high, but until proven otherwise it's supporting the rally. The Nasdaq Summation Index joined the Percentage of Nasdaq Stocks above 50-day MA in feeling the pain. Technicals turned net bearish as the breadth indicator returned to breakout support. The immediate impact of breadth weakness on the Nasdaq was small. The index continued to hug ascending resistance from the broadening wedge.  The index did finish the week lower, but volume was very light.  Further downside looks more likely, particularly w

Daily Market Commentary: Semiconductors Pummeled

Image
It wasn't a great day for the indices as the Fed refused to share its toys . The semiconductor index was looking  vulnerable after yesterday's close and it was no surprise to see it hardest today. Yesterday's confirmation of the 'bull trap' was followed by a 2%+ drop. Worse still, the index cleanly sliced below its 50-day MA as technical weakness expanded.  In the short term, the gap down is likely to close, but it will struggle to get above 430. Feeding the uncertainty in Techs  is broadening weakness in Nasdaq breadth.  After a period of stability the Nasdaq Summation Index swung lower with technicals net bearish. As yesterday's weakness in the Nasdaq Percentage of Stocks Above 50-day MA expanded following Tuesday's trendline break. While weakness in the Nasdaq was able to find new support at its 20-day MA.  But given the picture in the semiconductors it's likely to head lower. The Russell 2000 confirmed a new 'bull trap',

Daily Market Commentary: Retains Gains But Pressure on Semiconductors

Image
It was a down day for markets, but losses weren't enough to reverse Monday's gains.  Volume did climb to register a distribution day, but until volume converts into late day selling it isn't killing the rally.  The real concern is the semiconductor index. The issue with the semiconductor index is the 'bull trap' generated from the failed break of 440 last week. Up until today there was the possibility of a quick reversal in the 'bull trap', but the -1.6% loss left it sitting on 20-day MA support. This weakness will pressure the Nasdaq rally and restrict further gains the longer the 'bull trap' holds. The Nasdaq rally will also be contained by a break in the trend in the Percentage of Nasdaq Stocks above the 50-day MA; it's a small break, but it might prove telling. The Nasdaq is holding its ground despite weakness in breadth and semiconductors. Small Caps are holding on to 833 support. While the S&P had a quiet day, alth

Daily Market Commentary: Good Day For Bulls

Image
It was a good pick up by buyers as positive economic data  helped drive markets higher.  Volume was somewhat light which dulled the gain, but some of the creeping bearishness in the indices was repelled by today's action. The Russell 2000 negated the 'bull trap' for a second time as the 20-day MA retained support.  A quick move above 847 could see Small Caps go on a little run as relative strength has begun to swing in its favor after a couple of months of under-performance relative to Tech stocks. The Nasdaq may have slowed its December advance, but it is trading well above its 20-day MA with decent volume. The S&P went a step further than both aforementioned indices and managed a new closing high for the rally, albeit on the lowest volume gain for the indices. While the S&P has yet to make it past 2007 high's it has taken on a leadership role over the past couple of months. Small Caps will soon be take on this mantle, but until then, Large Cap

Archive

Show more