Posts

Weekly Review of Stockcharts.com Publishers' Charts

Image
Friday's selling will have given the bears something to cheer but the back hasn't been broken for this rally. Anthony Caldaro of Objectiveelliotwave.com tracks pivot prices for the S&P with wave 3 up in play; rally intact with wave 3 targets of 1,219 and 1,326. Yong Pan of Cobrasmarketview maintains neutral rankings on the short term and mixed sentiment on the intermediate time frame  Watch for black candlestick (strong gap open) for Monday; note all 'short sell' trigger Inverse CPCE peaked Same setup for the QQQQs Richard Lehman of Trendchannelmagic.com is watching broader February channels within which are mini-channels which broke for market leading small caps and Tech. 3/21 -- Friday's minor dip simply took the Dow to its lower blue minichannel line, where it promptly bounced before the close. The SPX did roughly the same, but the Naz, RUT, and tech stocks penetrated their blue minis and are heading toward their green channel lines.

Weekly Market Comentary: Rally Continues

Image
Although Friday's selling took much of the shine off the week's action it was still another victory to bulls. The good news is there is still plenty of room to resistance as the S&P illustrates - although it will be a while before a fresh 'confirmed buy' signal is generated. The Nasdaq too is not short on long side opportunity although volume was down. Note new MACD trigger 'buy' The Nasdaq 100 is the closest to resistance; only 45 odd points before it gets to the first of the 2008 reaction highs at 1,978; memories of the credit crunch far behind! Note too it enjoyed a new MACD trigger 'buy'. Keep an eye on this index next week - what goes here will likely play out for the Nasdaq and S&P. The Russell 2000 is not in the game simply because its comparable 2008 reaction high is significantly higher than the relative reaction highs of other indices -- so there is plenty of upside room for small caps to move. Breadth indicators are pushing be

Stock Market Commentary: Pause

Image
It was perhaps too much to ask for but the S&P finished the day flat with lower volume too. The only stumbling block came with a loss for the semiconductor index. But it was only enough to take it back to triangle support. Volatility down at 17.2 is getting closer to its 10-year low at 12.5 but technicals aren't quite oversold Friday looks like it will be a down-day given Thursday lacked the follow through after two solid days and this rally needs a sizable down day to take the heat off a little. Follow Me on Twitter Build a Trading Strategy in Zignals; Read how and earn real money (once out of Beta) in this PDF. Dr. Declan Fallon, Senior Market Technician for Zignals.com , offers a range of stock trading strategies for global markets under the user id: ‘Fallond’, ‘ETFTrader’ and ‘Z_Strategy’ available through the latest rich internet application for finance, the Zignals Dashboard or the Zignals Trading Strategy MarketPlace . Zignals offers a full suite

Stock Market Commentary: What Goes Up Must Go Higher

Image
The S&P has closed higher in 12 of the last 14 sessions and I wouldn't be surprised if it made it 13 out of 15. Wednesday's close followed a second accumulation day in a row, so there is no obvious easing in demand. The only index to offer a point of concern was the 'shooting star' for the Nasdaq 100. There was no accumulation registered for this index. Even the Percentage of Nasdaq Stocks Making New Highs broke to new highs. For Thursday bears need to watch the Nasdaq 100 for possible leads. Bulls can expect more of the same! Follow Me on Twitter Build a Trading Strategy in Zignals; Read how and earn real money (once out of Beta) in this PDF. Dr. Declan Fallon, Senior Market Technician for Zignals.com , offers a range of stock trading strategies for global markets under the user id: ‘Fallond’, ‘ETFTrader’ and ‘Z_Strategy’ available through the latest rich internet application for finance, the Zignals Dashboard or the Zignals Trading Strategy Mar

Stock Market Commentary: S&P Breaks

Image
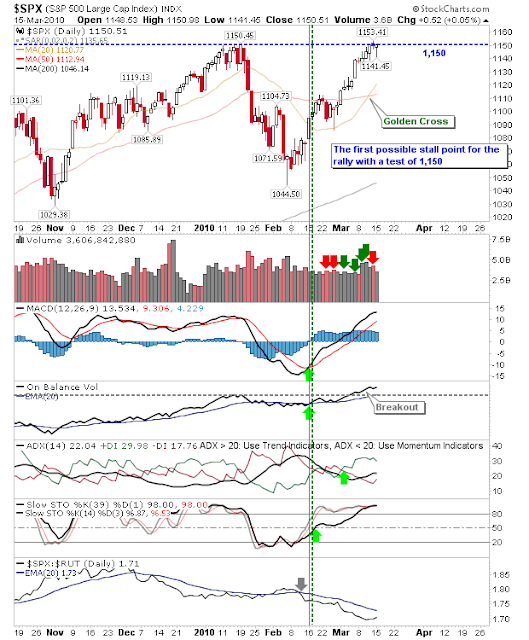
Shorts which took the jump at 1,150 in the S&P were forced to cover as the index pushed towards 1,160. Volume climbed to register an accumulation day although in relative terms volume was not excessive. The push higher in the S&P was enough to keep the rallies in the Nasdaq And Russell 2000 intact Have a semiconductors broken triangle resistance, or is it simply a need to readjust resistance? I wouldn't be surprised to see some follow through upside as shorts are forced to reposition themselves. Follow Me on Twitter Build a Trading Strategy in Zignals; Read how and earn real money (once out of Beta) in this PDF. Dr. Declan Fallon, Senior Market Technician for Zignals.com , offers a range of stock trading strategies for global markets under the user id: ‘Fallond’, ‘ETFTrader’ and ‘Z_Strategy’ available through the latest rich internet application for finance, the Zignals Dashboard or the Zignals Trading Strategy MarketPlace . Zignals offers a ful

Stock Market Commentary: Stubborn Bulls

Image
Bulls just don't want to let go of this rally, but letting go is perhaps the best thing they could do at this stage. It was commendable for the S&P the initial selling didn't stick; closing on resistance for a third day. Can it build with a breakout as has passed for Tech and Small Cap indices? Similar story for the Nasdaq except it has already broken past resistance - watch for test of 2,323 support Although the semiconductor index did not fare so well, it lost 1.4% bringing it back to the golden cross between its 50-day and 20-day MAs. Watch for a developing triangle consolidation which will likely mean sideways action for the Nasdaq and Nasdaq 100 Tuesday will likely see another challenge on Monday's lows unless the S&P can break resistance - in which case all key indices will be in alignment, providing the momentum to keep the rally rolling for another day. Follow Me on Twitter Build a Trading Strategy in Zignals; Read how and earn real money (once

Weekly Review of Stockcharts.com Publishers' Charts

Image
Friday's slightly weaker close topped what was another good week for markets. What is the outlook going forward. Anthony Caldaro of Objectiveelliottwave.com has a marked 3-wave top in the 60-min S&P. Intrigued by the newly listed "SC1" and "SC2" on the weekly; is this a long term bull call? Are we in a third phase rally which will break to new highs and beyond. Yong Pan of Cobrasmarketview shows a neutral short-term picture but a more mixed intermediate time frame; nothing to suggest a market top??? But is volume declining marking a top? Black candlestick on SPY chart is rarely a good thing. Mechanical Trading Strategy has new stop-loss low. Richard Lehman of Trend Channel Magic sees similarities to February 3/13 -- The markets continue upward, albeit at a reduced upward pace. You can see the flattening action on most of the upward blue mini channels in short term charts. As I pointed out on the Naz chart, the price action and stoc

Archive

Show more