Posts

Showing posts matching the search for etoro

Russell 2000 takes a step lower

Image
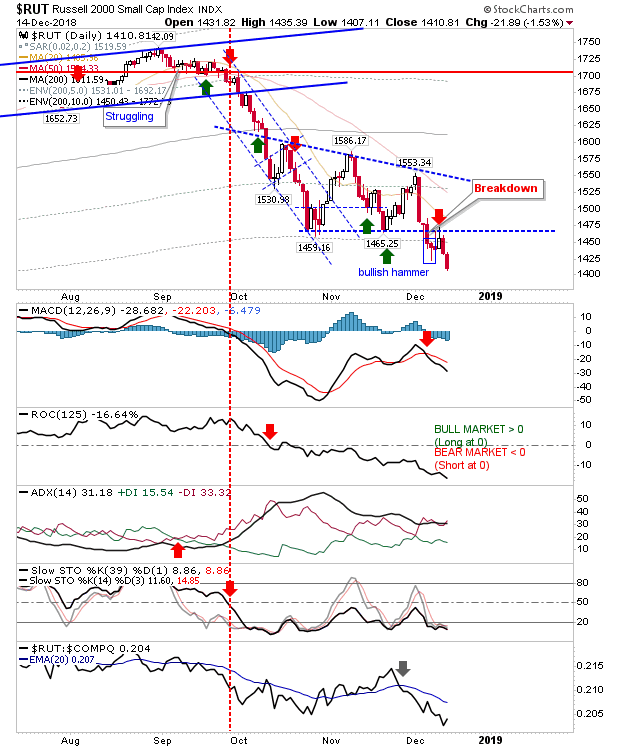
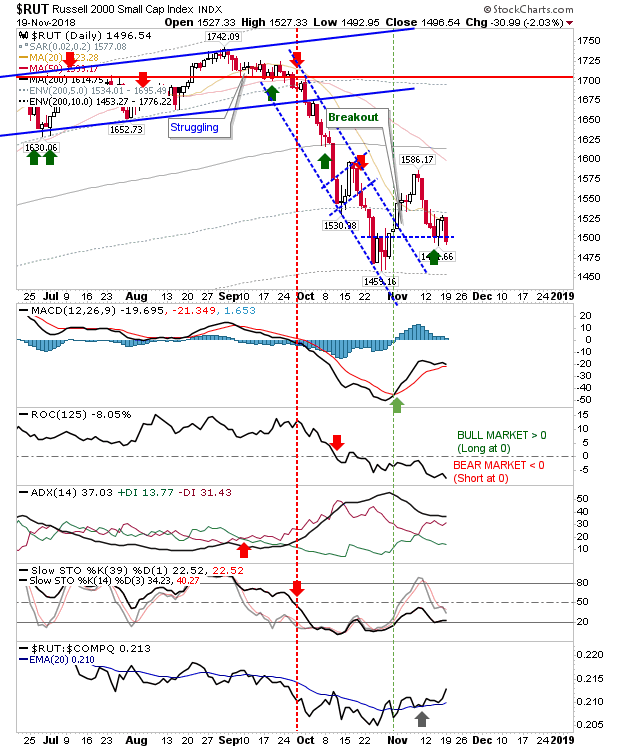
While it wasn't the biggest loser on the day, the Russell 2000 did manage to undercut the bullish hammer - ending any chance for a Santa rally of note. Look for this weakness to repeat for the S&P and Nasdaq. The Russell 2000 is still in the accumulate zone for investors and Friday was another chance to add to positions. Again, this may be only the start of the decline but without knowing what may be coming one needs to take chances as they appear.

Bearish cover undermines nascent bounce

Image
Since October's sell-off, down days that racked up losses of 3% or more have garnered much media attention, but the action of the last two days looks a lot more bearish than one of those big sell-off days. The Nasdaq posted a small bearish black candlestick on Wednesday, which was followed by a small bearish engulfing pattern today. Given this followed from an earlier bullish hammer, it now looks like this bounce is losing momentum and another push towards sub-6,800 is on the cards. There is an uptick in relative performance (vs the S&P) but I wouldn't be looking for this to last.

Markets struggle to build on yesterday's bullish 'hammers'

Image
It was a good finish for bulls on Monday but there was a lack of follow through on what should have been a good day for buyers.  However, damage was still relatively light. Technicals for the S&P reverted to a net bearish state as other indices lost ground. The S&P cut into yesterday's spike low but not enough to negate the bullish hammer. I would look for another spike low and would measure risk on a break of 2,580.

Russell 2000 breaks support; other indices to follow?

Image
A tough close for markets on Friday.  The week finished with a decisive break of support for the Russell 2000 which undercut the prior double bottom - this sets of a bad precedent for other indices. There is still a chance for a 'bear trap' but markets will need to recover 1,465 over the next few days - Monday preferably. To add insult to injury, technicals are all net negative and relative performance accelerated lower.

Trump punches Santa in the stomach

Image
Well, that didn't last long, Trump's comments on Chinese tariffs stuck a knife in the rally but the damage wasn't total. Anyone who shorted or sold the resistance test in the S&P will be happy, but breakout buyers in the Nasdaq will have been stopped out as a 'bull trap' is confirmed. The S&P gave up both the 50-day and 200-day MAs as the rate-of-change remained in sub-zero territory throughout the rally. Both the MACD and On-Balance-Volume are holding on to their bullish signals but there needs to be a sharp recovery (starting Thursday) if these signals are to hold. Investors were offered another 'buying' opportunity as part of the buying the dips after the Oct/Nov 'buy' signals.

Santa is off to the races

Image
A good finish to the week left no doubts as to which side had control of the market this week. Bulls stepped up Wednesday and added a finishing touch Friday. Volume climbed in confirmed accumulation. Where possible, I have drawn new resistance lines connecting October and November swing highs which are the new upside targets for current market rallies. The S&P hasn't turned fully net bullish (in technical strength) but it's only a couple of days away from doing so. The index finished Friday on its 200-day MA which may offer some resistance on Monday.  Get past that, then there is the 50-day MA before the index gets to challenge the resistance line from recent swing highs.

Bottom Building Picks Up The Pace

Image
The Fed stepped in at a good time with positive comments on rate increases as markets put some distance on recent swing lows. All markets now have a bit of wiggle room to defend and with seasonal 'Santa Rally' ready to kick off then we yet have more good news to come. The biggest one-day gain was the Nasdaq 100, it gained over 3% on higher volume accumulation. These gains came with a bullish cross in relative performance against the Russell 2000 and 'buy' signals for the MACD and On-Balance-Volume.  The first test will be the convergence of 50-day and 200-day MAs around 7,100.

Markets continue to shape a swing low.

Image
Today was a good day for market bottom watchers as new support levels kicked in for indices. Best of the bunch looks to be the Russell 2000.  It still has a relative performance advantage and the bottom it's shaping came off a 'real body' bounce alongside a fresh MACD trigger 'buy'. It's early days, and the 'buy' signal I had marked as a retest was perhaps a little early but should still be good enough that such buyers will still be holding at this stage; stops on a loss of 1,465.

Russell 2000 digs in again - Fresh 'Buy' for Thanksgiving

Image
It could have been better but bulls should be happy with the work done in the Russell 2000. Yesterday's close pushed the index into the 10% zone of historic weak action (reached in October 2018) while also confirming a double bottom on a two-bar reversal. It's a second 'buy' signal after last Thursday's failed.

Long Term Investors Get Another Bite But Traders Under Pressure

Image
A mixed bag of action. Long-term investors can look to the losses in the Russell 2000 and Nasdaq as another accumulation opportunity but if you bought Thursday's bullish piercing pattern of the Nasdaq as a near-term trading opportunity you will likely have been stopped out - or feeling ready to flee. As a trading opportunity, the Russell 2000 is just above its stop zone (loss of Thursday's piercing pattern low). The MAD is still holding its 'buy' trigger along with its relative performance advantage, but ROC is accelerating lower - moving deeper into bear market territory. Investors shouldn't fear the noise and keep on dabbling a little here and there on the buy side.

Confirmation of October Lows Continue

Image
Thursday began the confirmation of October swing lows with bullish piercing patterns and Friday kept this momentum running - even if there is still lots of work to do. The S&P closed at Thursday's highs and kept away from the latter's lows. Volume was a little lacking but technicals, aside from the MACD, are bearish. Monday's edge favors bulls.

Bullish Piercing Patterns on Accumulation: Investor Buy

Image
The developing (major) swing low got a big boost with another sizable wide range, bullish piercing pattern - similar to the bullish reversal candlestick from October 31st. Again, cautious investors who have been buying the extremes should still be active, particularly in the Russell 2000. Yes, new lows are possible, but nobody can predict the future and you can only act on the present - and now is a good buying opportunity. The Russell 2000 was able to defend the mini-congestion zone from the end of October (the horizontal, blue hashed line). Rate-of-Change is still in the bear zone but relative performance is still positive and the MACD is clinging to a 'buy' trigger.

Rallies intact despite recent losses

Image
After returning from my brief vacation markets enjoyed decent gains which - over the last 3 days - have given back some of the advances. However, markets remain well positioned to confirm a swing low (even if October lows are breached) and investors should be buying stocks, particularly on days where losses of over1% or more are registered. Remember, this is buying for 5 years+ down the road - don't fret the daily noise. For pessimists, there is the Semiconductor Index and Copper prices.  Copper prices broke before Semiconductors as lower demand for the base metal ultimately reflected itself in lower demand for chips, which is hurting and will continue to hurt the Nasdaq and Nasdaq 100. Keep an eye on this chart for a bottom. The likelihood is that more losses are on the cards for both copper and semiconductors.

Rallies Run Into Channel Resistance

Image
The initial bounces off spike lows have encountered their first major test of supply with pushes into newly drawn channel resistance. All indices are mapping this price action. First up is the S&P. Today's action finished with a spike high bang on channel resistance. Technicals are negative with the exception of relative performance, which has been tracking higher since September. Shorts may look to attack here and are likely expected to do so - if they don't emerge then we can think about Fibonacci retracements of the entire September-October move.

Volatility Picks Up as Selling Volume Lightens

Image
Intraday ranges were wide as indices struggled between building swing lows or selling off even more. By the close of today's business, indices were indicating lows are not in place and further declines are likely but these may be nothing more than spike lows (on yet another wide range day). Whatever happens, the investor `buy`signals are still in effect for the S&P and Russell 2000. The S&P experienced a 4% range between highs and lows as the relative performance continued to swing back to Small Cap stocks (after an extended period of outperformance from September). Sellers look to be exhausting themselves as volume took a significant drop.

Losses Look Bad But Long Term Investors Should Be Accumulating

Image
Friday was ugly but could have been a whole lot worse. What was particularly worrying was that certain indices were unable to defend either Thursday's close or open and were left set up for another big push lower. However, by the close of business - while not pretty - these indices were certainly better than they could have otherwise been.  That's not to say indices can't or won't go lower, but if you are buying low and selling high we are in one of those buying low setups. The best index for buyers is the Russell 2000. Friday's action tagged the 10% envelope from its 200-day MA and is an area where 90% of historic action for this index since 1987 has been better than it is now. Should the Russell 2000 tag 1,378 it will reach the 95% zone of historic action. Friday's finish also left it better than halfway inside Thursday's range with a bullish hammer to boot. Relative performance is poor but likely oversold.

Sellers Step Up The Pace

Image
It was 2001 all over again as lead indices registered 3% losses on a day of solid selling and registered distribution. The 'bear flags' are history but their effects are still very much in effect. Worst affected was the Semiconductor Index as it gave up nearly 7% in a move which has the makings of a measured move lower.  The initial target is 1,115 which doesn't look entirely unreasonable after today. There was nothing bullish as relative performance (vs the Nasdaq 100) accelerated lower.

S&P Breakdown from 'Bear Flag'

Image
There was no acceleration in the losses for the Russel 2000 and Semiconductor Index but today it was the turn of the S&P to break from its 'bear flag'. It was more of a technical break than an absolute loss but given net technical weakness, it must be respected.

Breakowns in Semiconductors and Russell 2000 Indices

Image
There was no reversal on the 'bear flags' but in the case of the Semiconductor Index and Russell 2000 there were breakdowns from those same 'bear flags'. The Russell 2000 broke the 'bear flag' as the ROC dropped below zero to push it into 'Bear Market' territory. This is not good news for the broader indices as Small Caps leadership is a key requirement for secular rallies - and likewise for secular declines.

'Bear Flags' Take Shape in Indices

Image
Since the last update indices got their bounce but the last couple of days have seen these gains gradually erased. Over the course of the week, the entire bounce has the look 'bear flags' as part of larger measured moves lower.  Should this emerge then indices will be close to offering the long term 'buy' signals I track in the tables below every blog post I make (available on markets.fallondpicks.com for syndicated content). Last of which for all three indices was February 2016 For the S&P, the measured move target is 2,585. This comes on a day of higher volume distribution with an acceleration of On-Balance-Volume lower and other technicals net bearish. However, relative performance is accelerating higher (vs Small Caps) and the index is clinging on to its 200-day MA

Archive

Show more